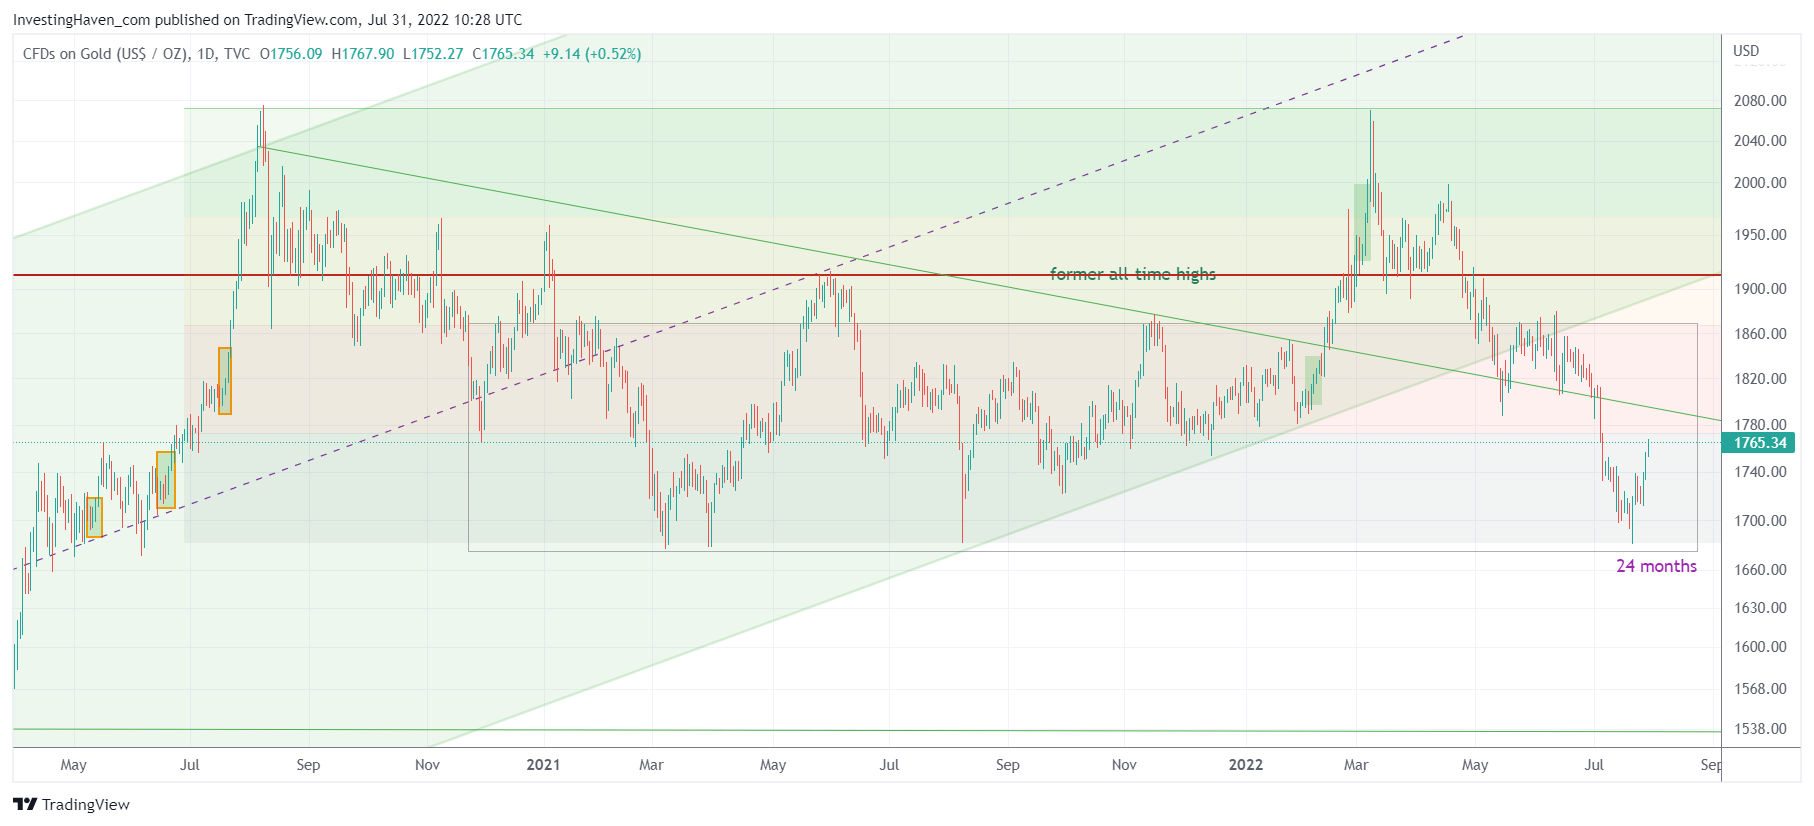
The gold chart is getting very interesting, to say the least. Not only did the crucial level of 1700 USD/oz hold on a daily closing basis, more importantly, the gold chart has a very special message, according to us: stagflation is here and it is here to stay for a long period of time. It also confirms that our bullish gold price forecast will eventually be achieved, the only question being whether it will happen in 2022 or 2023.
In June, it looked like the whole world was falling apart. Markets were crashing, we got a record number of days in which the Nasdaq was bleeding 4% or even more. Gold was crashing as monetary tightening was happening across the planet.
That’s when we wrote Gold Price Outlook Following FOMC Rate Hike In June and concluded:
The monthly Gold chart is still showing a Bullish multi year setup. A cup and a handle. We are currently in the frustrating yet constructive consolidation part of the set up (Handle, pink rectangle).
Last week, we followed up with A Gold Chart You Have To See As We Head Into Another FOMC Meeting
The US Dollar has been on a parabolic move to the upside. We believe this move is showing signs of exhaustions and could be coming to an end. We previously laid out the charts and details and published this week an update to where the US Dollar is heading: A Must See Bearish Pattern Forming On the US Dollar Chart.
And we concluded:
If the upwards move is done in the USD, that means that Gold will make a spectacular bounce from the bottom of this multi year consolidation channel. This bounce would clearly lead to the materialization of our Gold price forecast for 2022 with a price target of $2500.
After the FOMC meeting the price of both gold and silver went strongly higher. We got a bullish micro-pattern on both charts, the one on the gold chart being really important because it happened right at the 2021 lows (they were respected, in a textbook fashion).
The gold chart, if we zoom out, shows what seems to be a very boring consolidation.
We would argue otherwise.
First, this is a long and strong consolidation. What we do know, from history, is that the longer and stronger a consolidation, the more powerful the subsequent trend!
Second, if gold was able to hold strong, amid monetary tightening and softening economic growth, it must mean one thing: STAGFLATION is here. Given the structure, we would argue that stagflation is here to stay.
This implies one thing: eventually, gold will thrive, it’s a matter of when. Consequently, whenever that happens, silver will thrive even more. Silver will go ballistic eventually. This Silver Indicator says ‘Screaming Buy’.
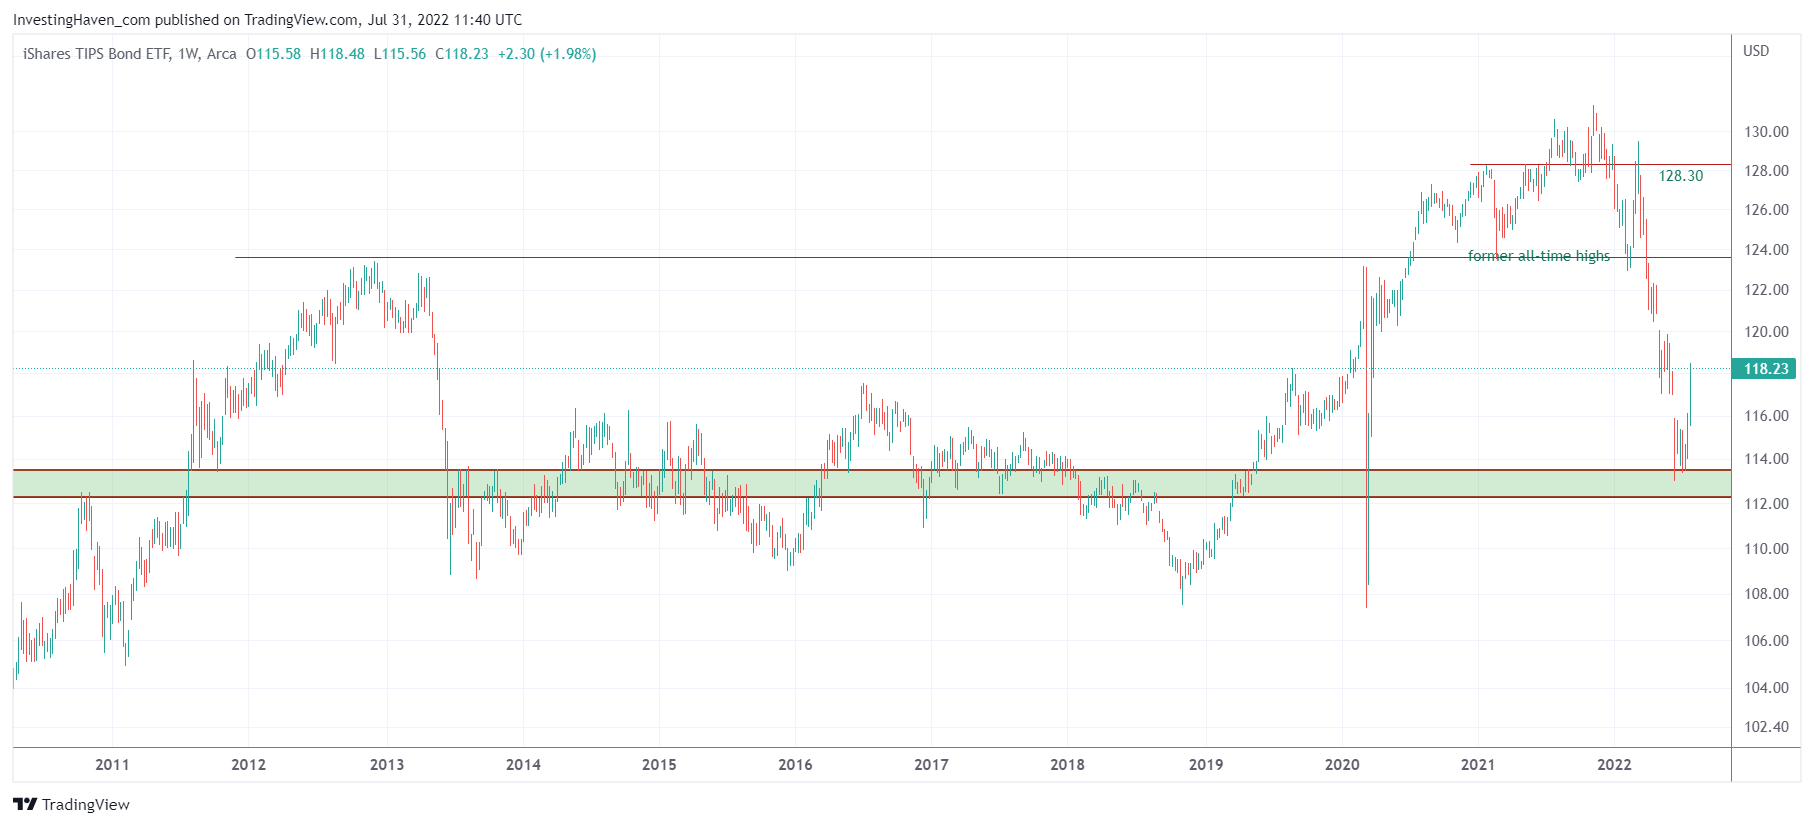
Here is a complementary chart: inflation expectations, weekly chart.
We got a true crash in the period April/June of 2022. This brought TIP ETF back to its support area going back 10 years in time.
Gold has been holding up really well amid such a violent decline in inflation expectations. This data point supports our stagflation thesis.
How to invest in a period of stagflation?
Very simple, you look for the few growth sectors.
Moreover, you wait until inflation sensitive markets like gold and silver get the ‘room and space’ to ‘do their thing’. Eventually, silver will move higher, much higher, the only question is when the market conditions will be set right to support a silver move.


