Since we wrote our gold forecast 2023, some 5 months ago now, when gold was trading near the 2022 lows, gold staged a remarkable comeback. Indeed, when the entire investor community lost faith in gold, we said it was not as bad as it looked because we remained focused on leading indicators.
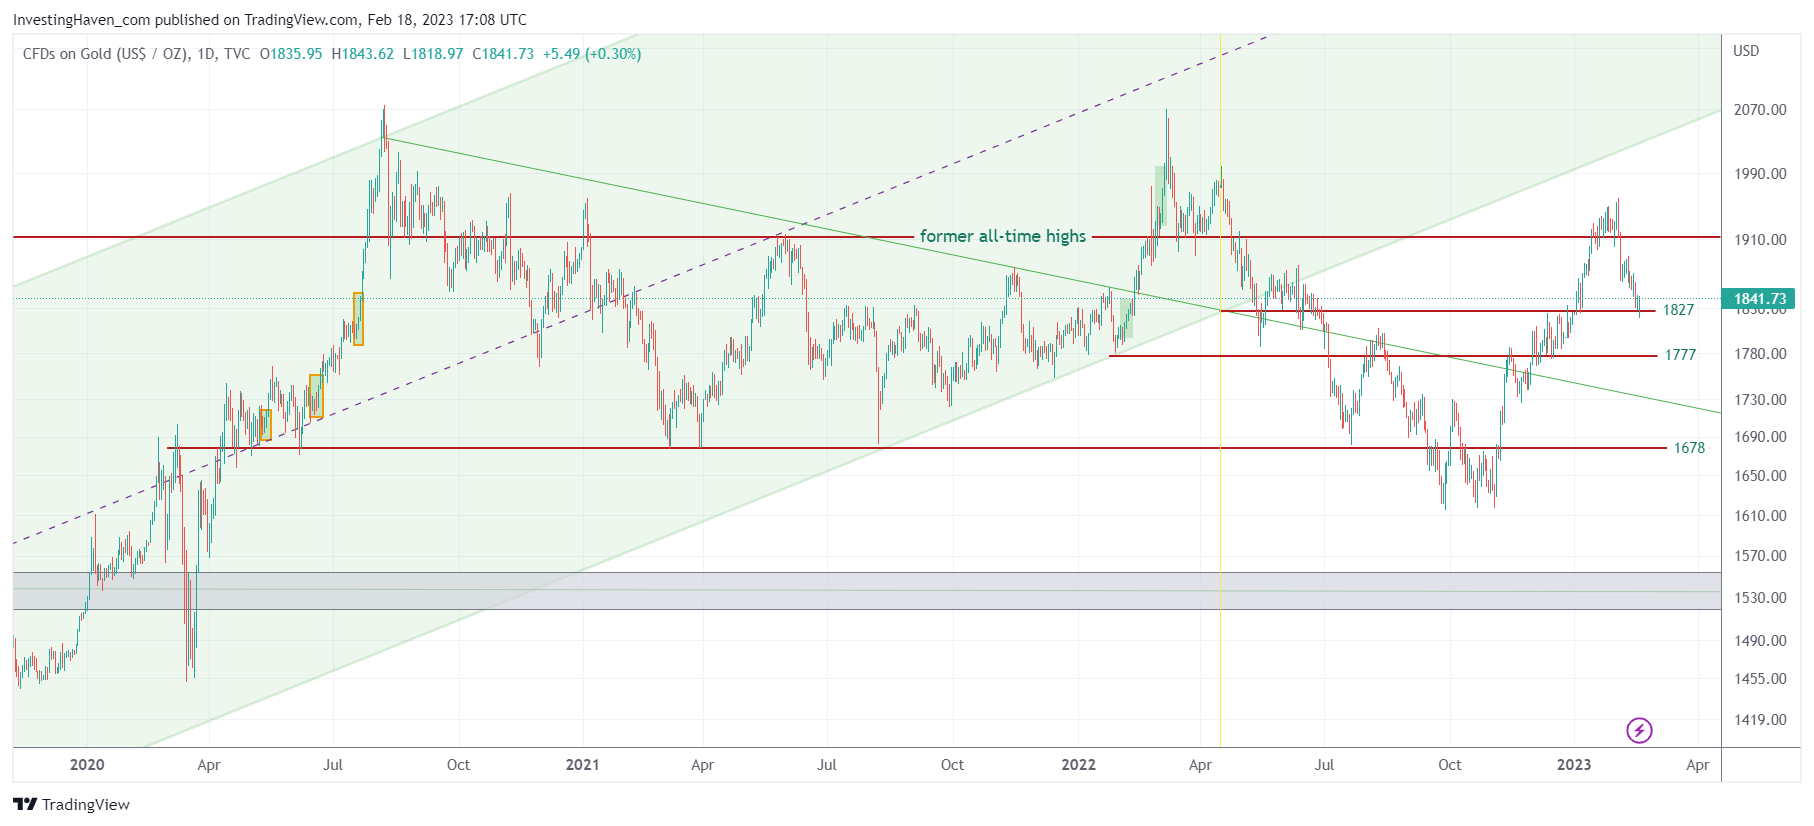
Golds chart is pretty choppy. It’s not easy to see structure and patterns on the daily gold price chart.
However, our annotations should bring in a structured way of looking.
We will break down the chart in what we believe are 5 key insights and developments:
- The multi-year rising channel (green shaded area) was broken to the downside in May of 2022.
- The price point that came with the breakdown is an important one: 1850 USD/oz. Interestingly, gold is currently trading right at that level.
- Some sort of inverted head & shoulders pattern was created after last year’s breakdown.
- The subsequent rally brought gold to 1950 USD/oz around Feb 2nd which was a turning point date in metals and markets. Essentially, 1950 USD/oz is a lower low against the peaks from 2020 and 2022.
- However, the more important point is that we believe that ongoing price action is part of a wide pattern. If so, we believe that the 2022 peak is the mid-point, so to speak, of some sort of W reversal.
If the last point is what the market is working on, then you can be sure that support level 1777 and the green falling trendline will hold. In that scenario gold will move back to 2000 USD/oz and clear that level, in the 2nd half of 2023.
We prefer silver investing though, because of gold will clear 2000 USD it should push silver close to its ATH.


