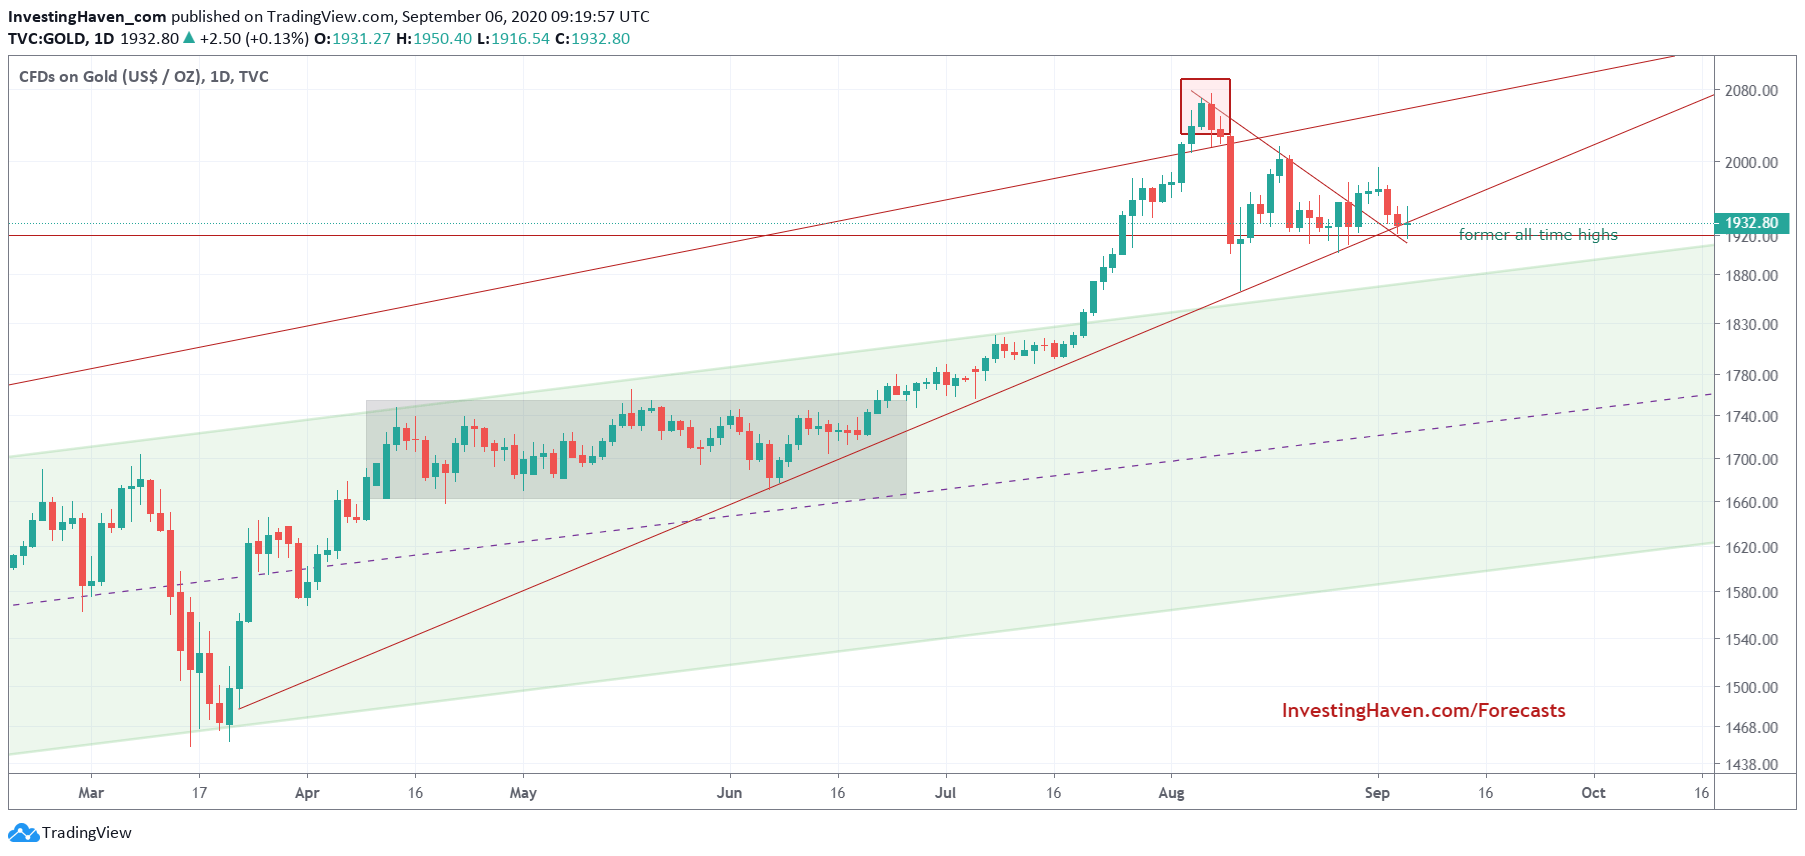
We noticed a few weeks ago that the gold chart was becoming very complex. It certainly did not change considerably, however we start seeing a few interesting things happening in gold. This one short to medium term oriented gold chart starts hinting at a new trend, and gives guidance on price levels to watch. Note that the current gold chart is not changing anything about our longer term outlook as defined in our gold forecast.
With that said let’s turn our attention to the daily gold chart, with our own annotations. A few observations that are pretty important to note:
- Upside: The gold price is way above the rising channel, which indicates its price has risen too fast too high.
- Downside: Gold still trades above former highs, and it is now creating a very (very) solid support right at former all time highs.
- Trends: Gold is now entering an intersection of trends, one we have never seen before on any chart. This is getting really unique: a rising wedge, horizontal support at multi-decade all-time highs, with a medium to long term rising channel about to meet former all-time highs.
All we can say is that (1) this is a unique setup (2) former all-time highs will be acting as a pivotal area.
There is no way of knowing, purely based on this chart, how this will resolve. We have to look into leading indicators like the Euro (supportive for gold) and inflation / interest rates (potentially less supportive for gold as explained here Meet The Breakout Of The Year: Interest Rates ).
In other words, wait and see.
As an investor it is pointless to initiate a gold position around current levels, unless you have found that one or two gold miners that will rise anyway (we have found them, simply waiting to understand if and when we should enter).
As a trader this set up opens up opportunities.


