Gold miners are undergoing a pretty important test. Call it a make-or-break level or a breakdown test. Regardless what we are going to call it, one thing is clear: if the current levels don’t hold up it will become really ugly in the precious metals mining space. Our bullish gold forecast and silver prediction are not going to come to the rescue because we clearly stated that both metals will be bullish later in the year, not as 2021 kicks off. We are not going to forecast an outcome of precious metals miners, all we are going to do is watch this space closely for a solid bottom or a major breakdown to occur.
Last week we noticed: Gold Continues To Bump Into Resistance In 2021 At Former Highs.
This process of rejection in the lower 1900 USD level continued this past week, and gold isn’t improving, at all in fact. Silver looks still acceptable, it looks like it is trying to create a solid long term reversal. The million dollar question is whether silver will hold up because of its base metal characteristic even if gold continues to show weakness.
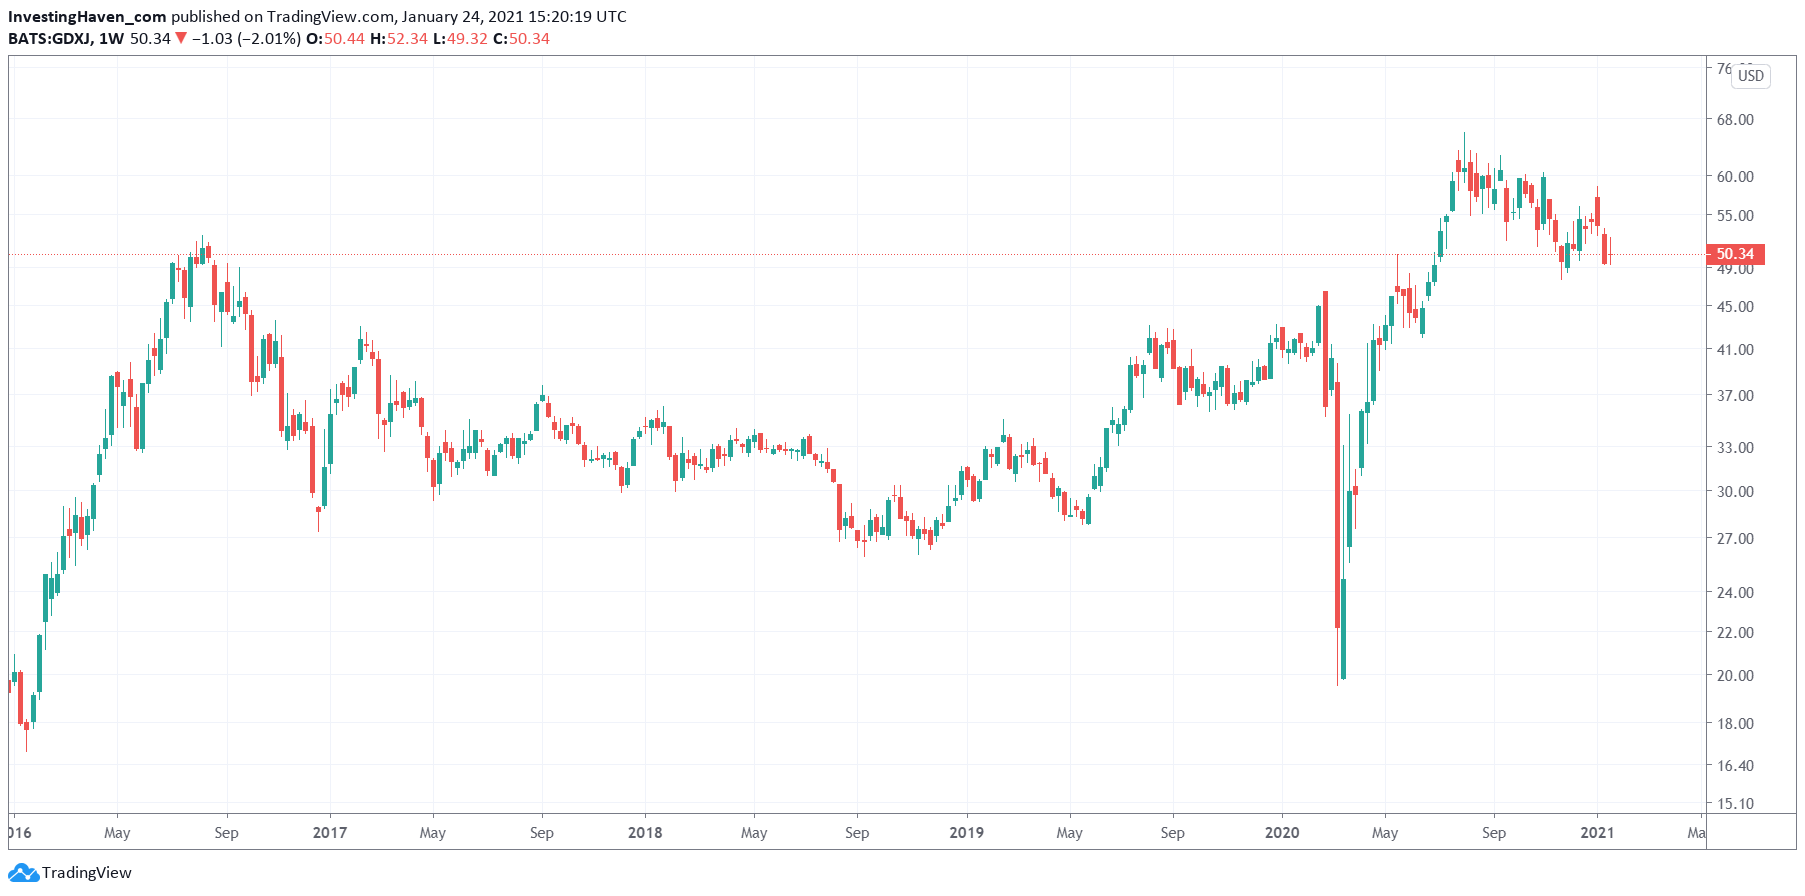
That said, we are featuring a chart without (!) annotations today: the junior gold mining index GDXJ ETF, weekly chart.
- The 2016-2019 reversal was beautiful, without any doubt.
- The subsequent crash in March of 2020 was spectacular, in hindsight.
- This chart also shows how the breakout attempt of GDXJ ETF in February of 2020 was stopped cold because of the Corona crash that was underway.
- Right now, this index is testing its 2016 highs and April 2020 wick.
Needless to say, if former resistance becomes support we will be very interested in GDXJ ETF in a few months from now. However, the opposite is true as well, if GDXJ ETF violates 48 points it will be ‘halleluja‘ time.


