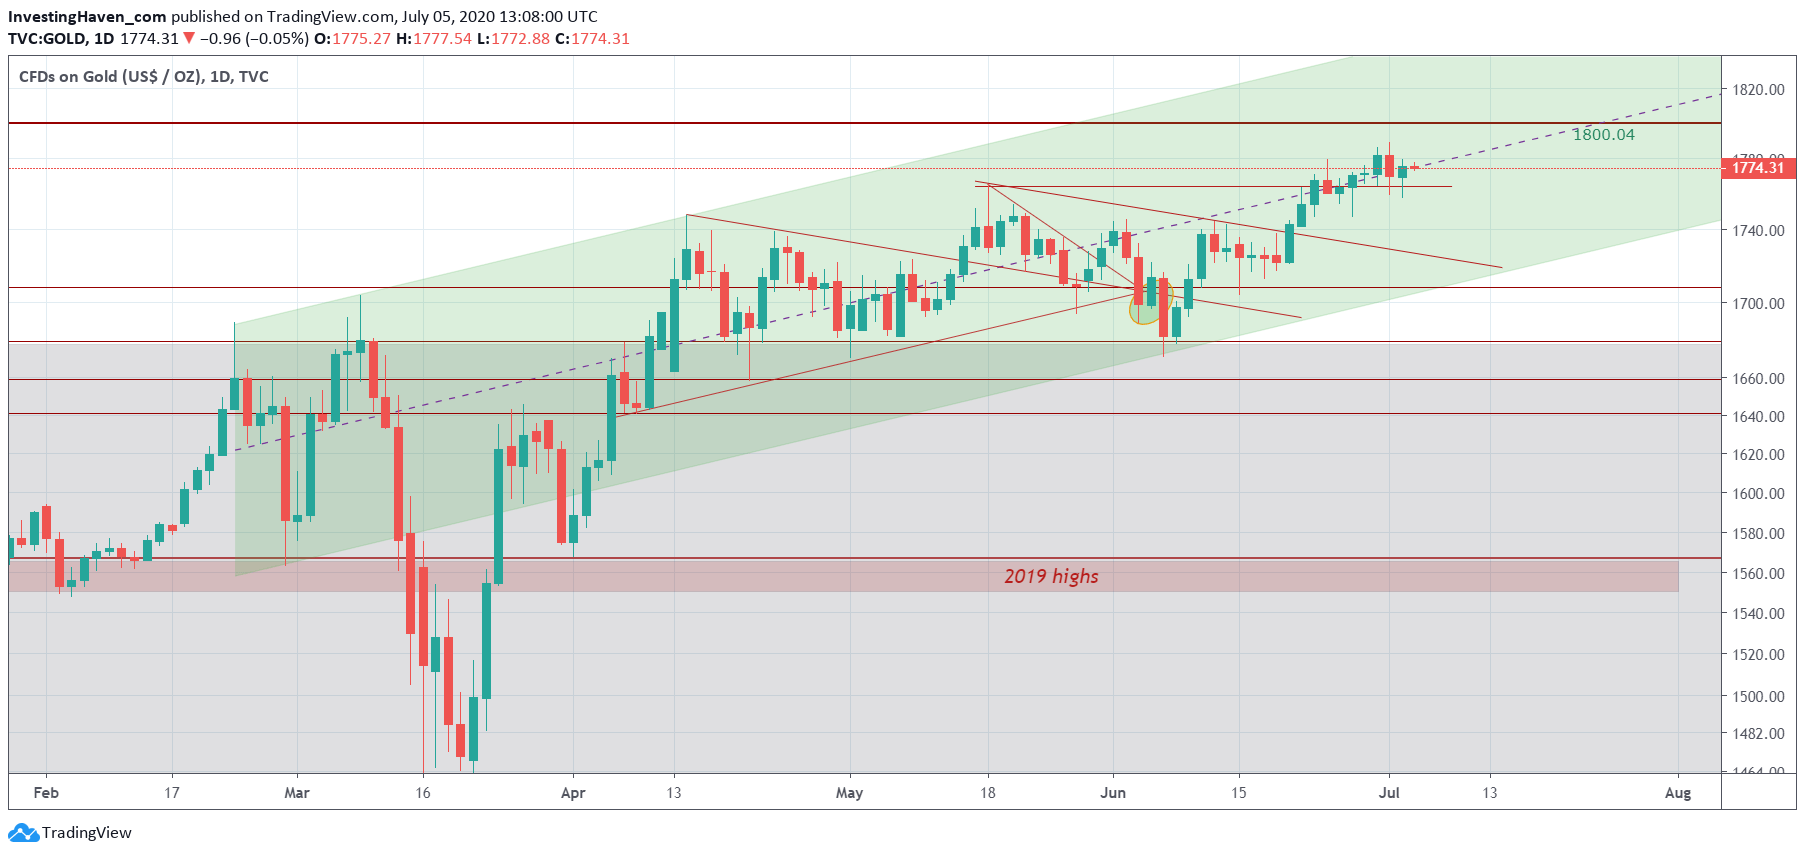
“It” is about to happen: gold will challenge its all time highs in the next few weeks or months. It is a matter of time. The one last hurdle to overcome is 1800.04 USD which is just inches away. We see gold’s chart taking out 1800 USD pretty easily, regardless of the fact it represents important resistance. Our gold price forecast for 2020 which we published 9 months ago was accurate but even conservative!
The daily gold chart looks really gorgeous.
After some sideways trading in May and June it seems now clear that the ‘break up’ from 2 weeks ago is confirmed.
The ‘break up’ occurred, for us, when gold moved above its falling resistance, around June 19th.
Gold has been acting pretty ‘weird’. It is mostly pretty volatile, both in its up and downtrends. Lately, though there has been a lot of sideways price action with some false ‘break ups’.
Regardless, the current gold chart setup is really bullish!
Note how 1800 is acting an important resistance line, going back 8 years in time. But the gold chart is now set to deal with this resistance. Why, how? The recent sideways trading created a solid base in the context of its rising channel to take out 1800 USD rather easily (maybe it requires 2 or 3 attempts).
Once 1800 USD is cleared we’ll see in ‘no time’ new all time highs.
Yes we expect gold to test 2000 USD in the next few months.
Note that MarketWatch featured our precious metals forecast last week, you can read it here Silver, copper prices mark an impressive recovery from March lows (MarketWatch).
Our Momentum Investing members are enjoying a great precious metals stock tip which we flashed 2 weeks ago. It was, by far, the strongest precious metals miner among mid and large cap miners. So far, in 2 weeks time, our members and our Momentum Investing portfolio has an unrealized profit of 30%. You too can follow our premium investing research and get (precious metals) stock tips by signing up here.


