
The price of gold, even more than silver, is supposedly very sensitive to interest rates. So when the Fed is expected to announce a 75 to 100 bps rate increase, this puts tremendous stress on Gold price. That’s the common consensus. Therefore, we published Silver Price Updates Following FOMC Rate Hike In June after the 75 bps increase by the Fed this week. Wit this, what is our take on gold?
As a reminder, our Gold price forecast for 2022 was and still remains bullish. We expect Gold to reach $2500 and recently published that Gold is still on track to close 2022 on a solid note. The trigger will be the US Dollar rolling over and we are seeing signs of topping in the USD price action.
Is this still the case after the FOMC announcement? That’s what we will cover in this article.
Gold Price Still Constructive After A Major Rate Hike in 2022
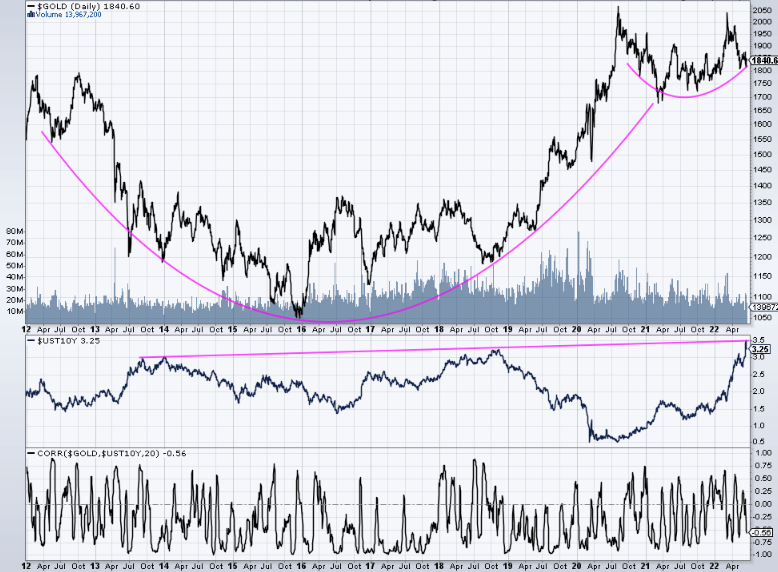
Gold is sensitive to Rate increases but an increasing rate environment isn’t going necessarily to suppress the price of Gold. As can be seen in the chart below, we have significant instances where Gold and rates are going up in tandem.
The correlation indicator at the bottom shows that the correlation ca go from positive to negative with a -0.56 average.

With this in mind, it seems reasonable to assume that even with further rate increases, Gold can still do well. We have to be careful making such assumptions however. They could create bias and bias is the enemy of objectivity.
So why feature this chart then? Because it refutes with facts the theory that in this environment of rising rates, Gold will crash and not do well.
And should the negative correlation hold here, we can see clearly in the same chart (the annotated version below) That Gold is setting up nicely for a breakout. The rates on the other hand look toppy:
But in order to assess Gold price, it is advised to focus on leading indicators such as bonds and the price of Euro. See our Gold forecast for more details. We also want to remain focused on Gold’s price chart.
Gold Price Action Following the Fed Announcement
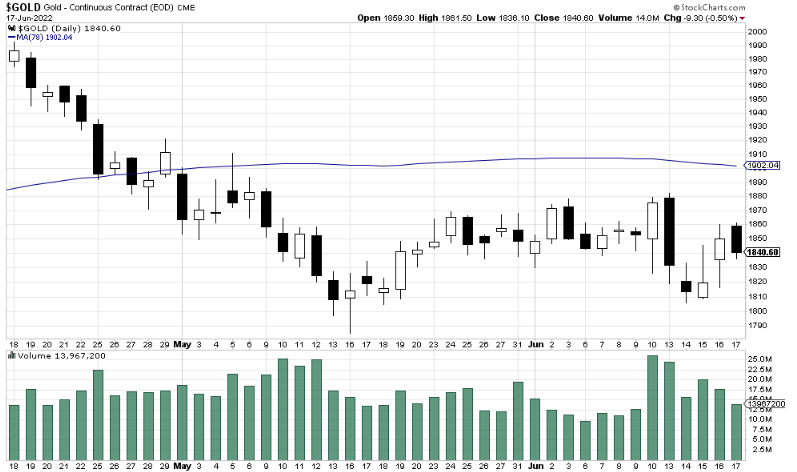
The daily chart, similar to silver, shows a brutal Monday the 15th close. The drop in price was followed by a bottoming candle and by Friday, the price had recovered most of this week’s losses. Overall, Gold’s recovery was relatively softer than silver.
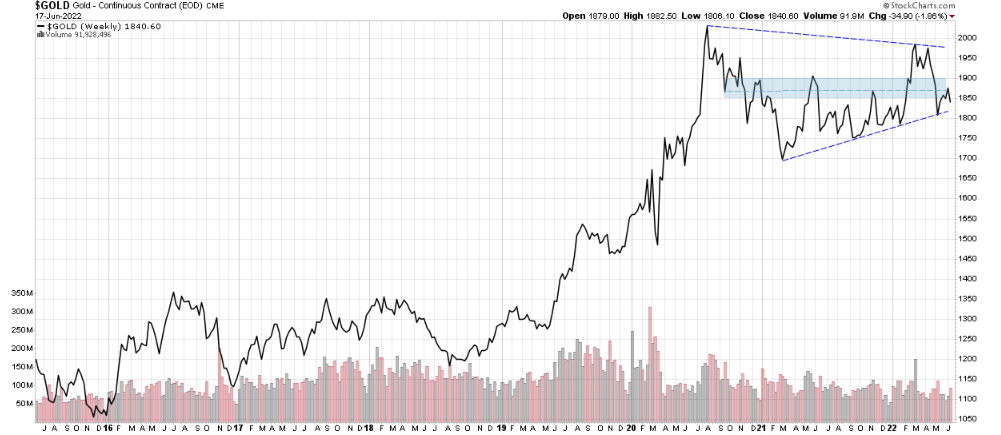
The setup on the weekly chart shows that Gold price might still revisit the bottom dotted trendline. The setup is still valid and we are close to a resolution. Invalidation target remains a weekly close below $1700.
The monthly Gold chart is still showing a Bullish multi year setup. A cup and a handle. We are currently in the frustrating yet constructive consolidation part of the set up (Handle, pink rectangle).
The price levels to watch for Gold remain the same as shared previously:
Since the support at $1800 held, $1850 to $1900 is the first resistance area. Once that’s cleared, crossing above $2000 signals the start of a breakout.
Gold price’s real breakout will happen once the price breaks and holds above 2100. Setup invalidation below $1750 (tight) or below $1700 (Loose).

We include silver price analysis both in our trading oriented Trade Alerts service as well as our stock investing oriented Momentum Investing service. Both services include silver price analysis in the weekend alerts.
Written by hdcharting, reviewed by Taki Tsaklanos


