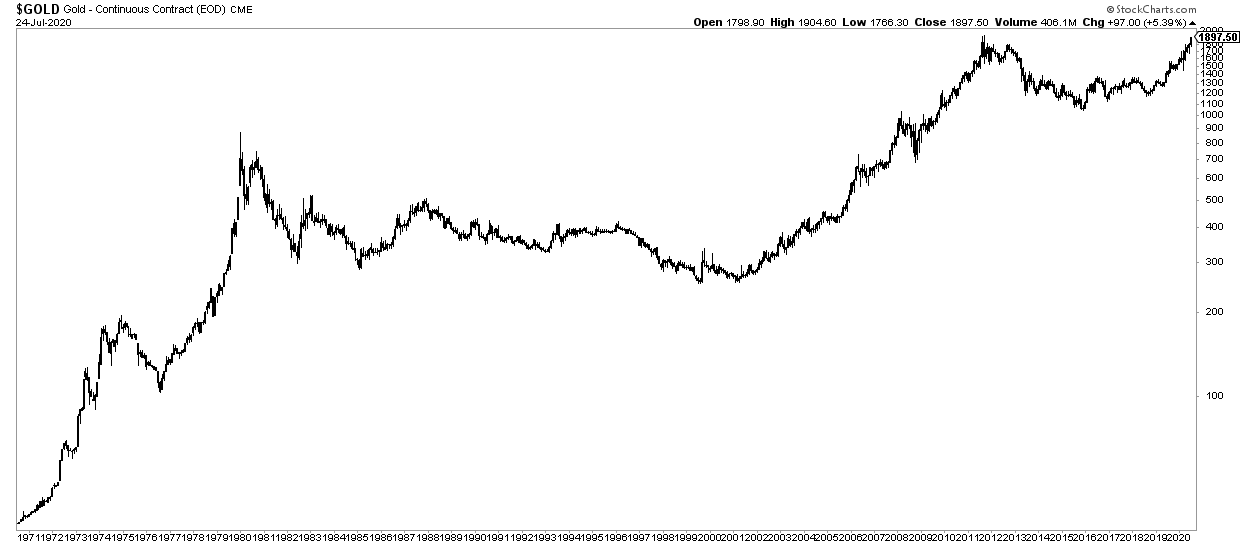
Gold is high, right? Correct, it’s even right below all-time highs, say ‘inches’ below it. But is it too high? Different question, and we would argue it is high but not ‘too high’. Whenever doubting about this type of question, just zoom out. In our gold price forecast predicted new all time highs, but only in 2021. So in a way our forecast is accurate, but it did materialize faster than expected … and this may just be the beginning.
The monthly gold price chart is the one we need. Below is the gold price monthly chart on 50 years. A few observations:
- We see some periods in history with accelerated moves up.
- The recent move (since 1200 USD in the last 3 years) is nowhere near parabolic. It looks like a warming up.
- The last 8 years marked a major cup, with a perfect reversal in the center.
- The energy on this chart is very bullish, and points only one direction: higher.
We believe the ongoing bullishness is not going to stop gold at all time highs, on the contrary. It probably is going to help push through it. A back test, once above 2,000 USD, may be expected.
For now, we see that the gold trade is the right trade, until proven otherwise.
Moreover, our COT indicator suggests we are nowhere near a crowded trade in gold, as of yet, subject to change of course.


