As said numerous times to our premium members: forget the news, the chart IS the news, the chart HAS the news. News follows price in the majority of cases. The gold market is no exception to this. The gold price chart has a phenomenal setup, but only if you are able to read it in an ‘unbiased’ way. Our new gold price forecast and silver forecast updates are underway so we’ll keep this post short but powerful. We conclude that it will be the week of US elections in which gold will make a bold move.
Note that longer term we are still forecasting a good outcome for the gold market, assuming additional monetary and fiscal stimulus combined with a falling US Dollar. Both need to be in place though
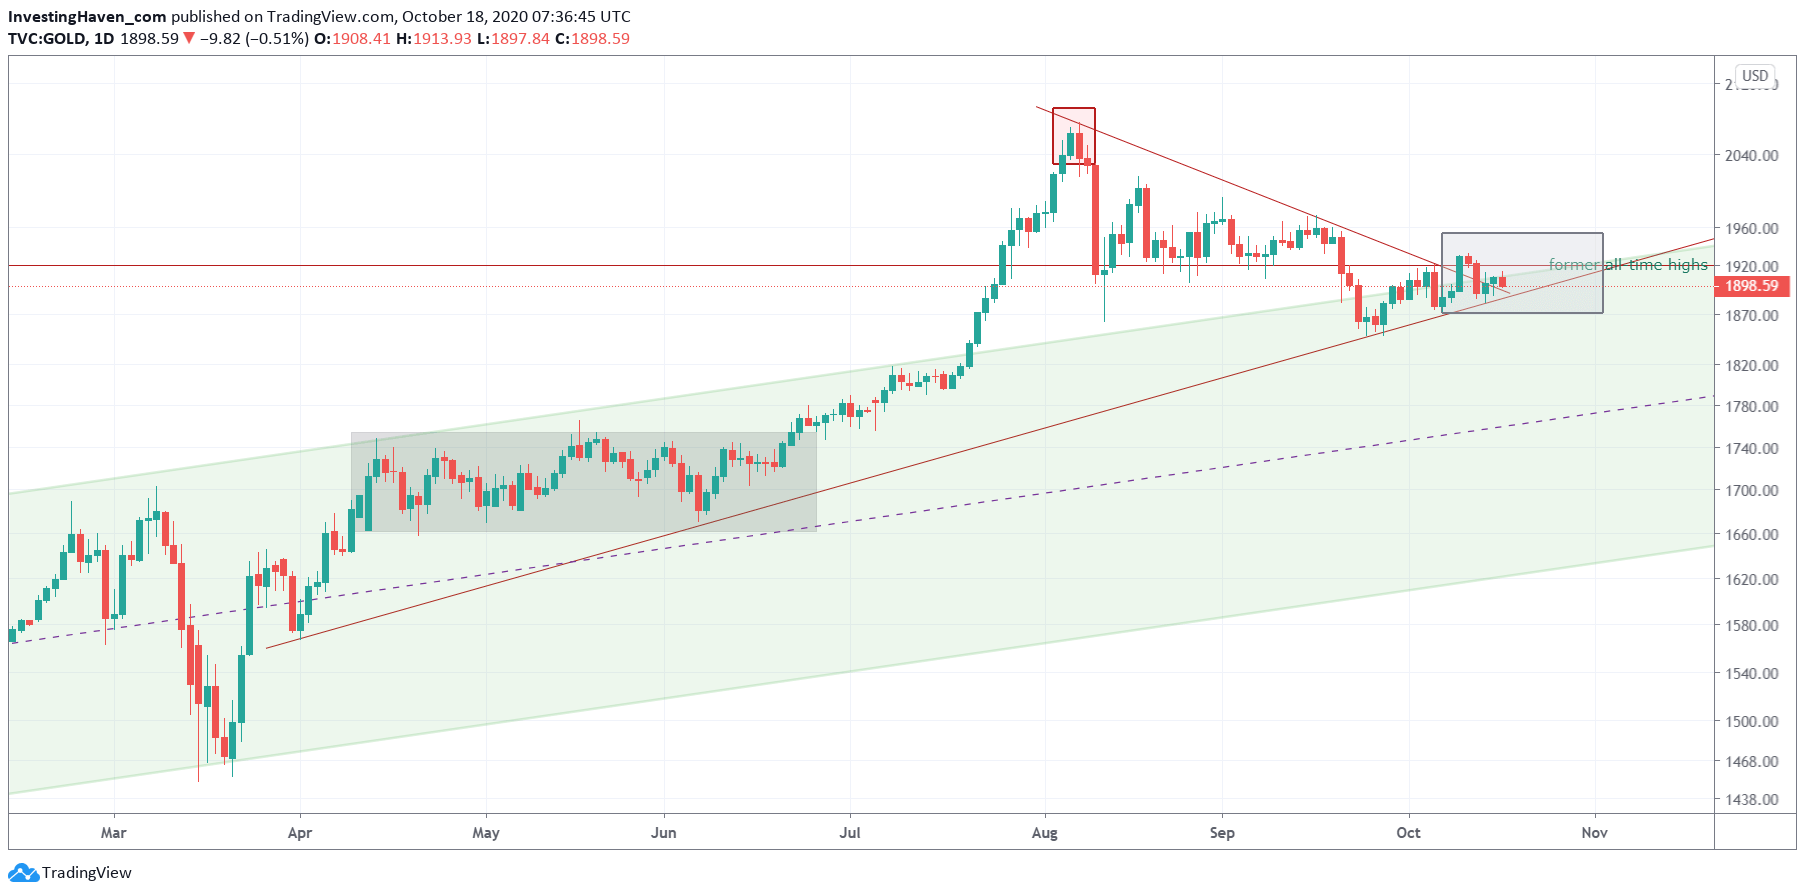
Shorter term we want to focus on the daily gold price chart for near term insights. Below we feature gold’s 2020 price move, pretty fascinating it is.
We had a nice uptrend until mid-July of this year. The uptrend accelerated since then.
Mid-September was a pretty awkward moment. Gold fell back below its former all time highs, back into its ‘normal’ rising channel (green channel below). The million dollar question back then was whether it qualified as a breakdown or anything else.
Anyone who is able to read a chart sees the ‘tension’ on this chart: there are 3 trends coming together around 1900 – 1940 USD. You bet this needs time until resolution.
And what we see now is that those 3 trends will almost ‘dissolve’ in the first week of November.
It’s pretty simple to us: if gold succeeds in trading above former all time highs, for sure during the entire first week of November, going into the 2nd week of November, it will results in a bullish outcome.


