It was a really interesting week in markets, particularly gold and silver. In our Momentum Investing portfolio we locked in a 22% profit in one silver miner, realized in three weeks. We got out of our precious metals positions on Wednesday, a few inches below what we believe is a top that mines on the short to medium term. At this very point in time it looks like gold and silver did rise too fast, and need a break, after hitting our higher targets as per our 2021 gold forecast and 2021 silver forecast. This idea is confirmed by interest rates and Treasuries. Yes, we are on recourd with a short to medium term market forecast that precious metals will take a break, and financial stocks will move strongly higher.
Our forecast as explained above is based on our intermarket analysis method.
As explained in great detail in our 100 Investing Tips For Long Term Investors:
The key point is that it is one primary trend that triggers a domino effect for other markets.
That’s what intermarket analysis stands for: capital flows from asset class to asset class, or from market segment to market segment, and decent chart analysis across markets can reveal where capital is flowing towards.
This is how intermarket analysis works:
- Markets move in relation to each other, they do not move in a vacuum. Capital flows from one market to another market, considering that cash is also a market (any currency). This flow of capital can be identified by thoroughly analyzing chart patterns and trends in a handful of leading assets. They are primarily treasuries, currencies, leading stock market indices, gold, crude oil.
- When leading assets arrive at decision levels they can do either of two things. Either they break out / break down or bounce back. In doing so, they influence other assets. This is the basis for a new market trend where several markets are part of a similar type of trend.
With that said, let’s turn our attention to 3 distinct charts.
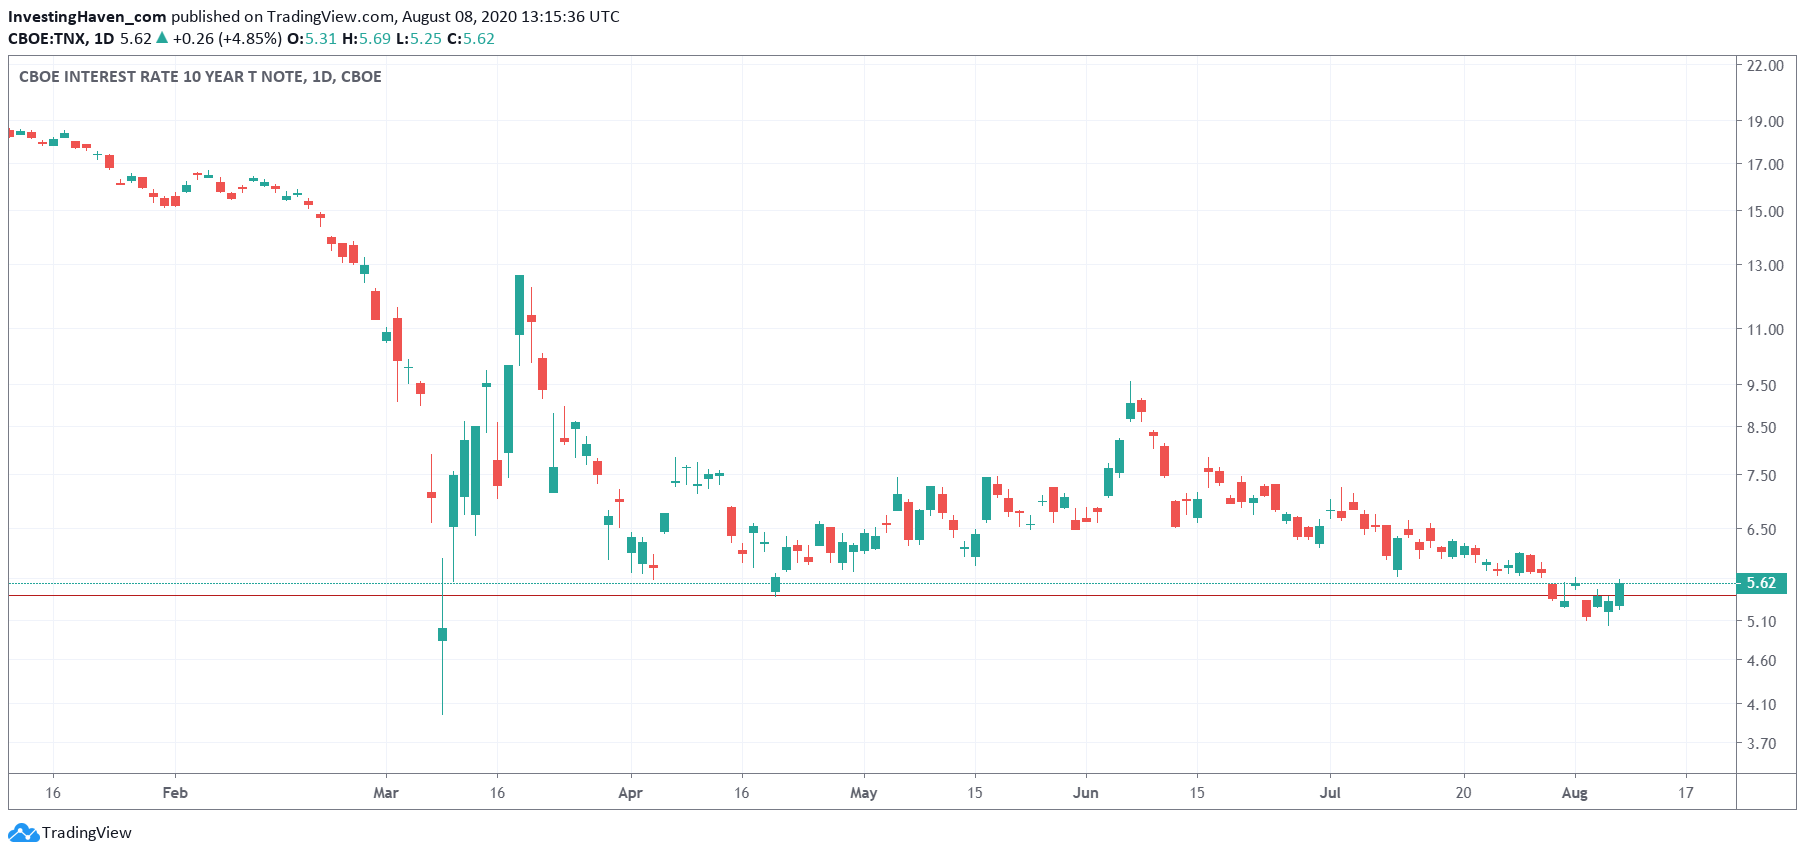
First, interest rates (10 year note).
After 5 straight days it looks from this chart that rates refuse to move any lower. Enough is enough, is what this chart tells us. We probably have set a long term bottom in interest rates. If this is true, not great for precious metals.
Short to medium term, we could expect rates to rise back to 9.00 where we might find an amazing entry point for precious metals.

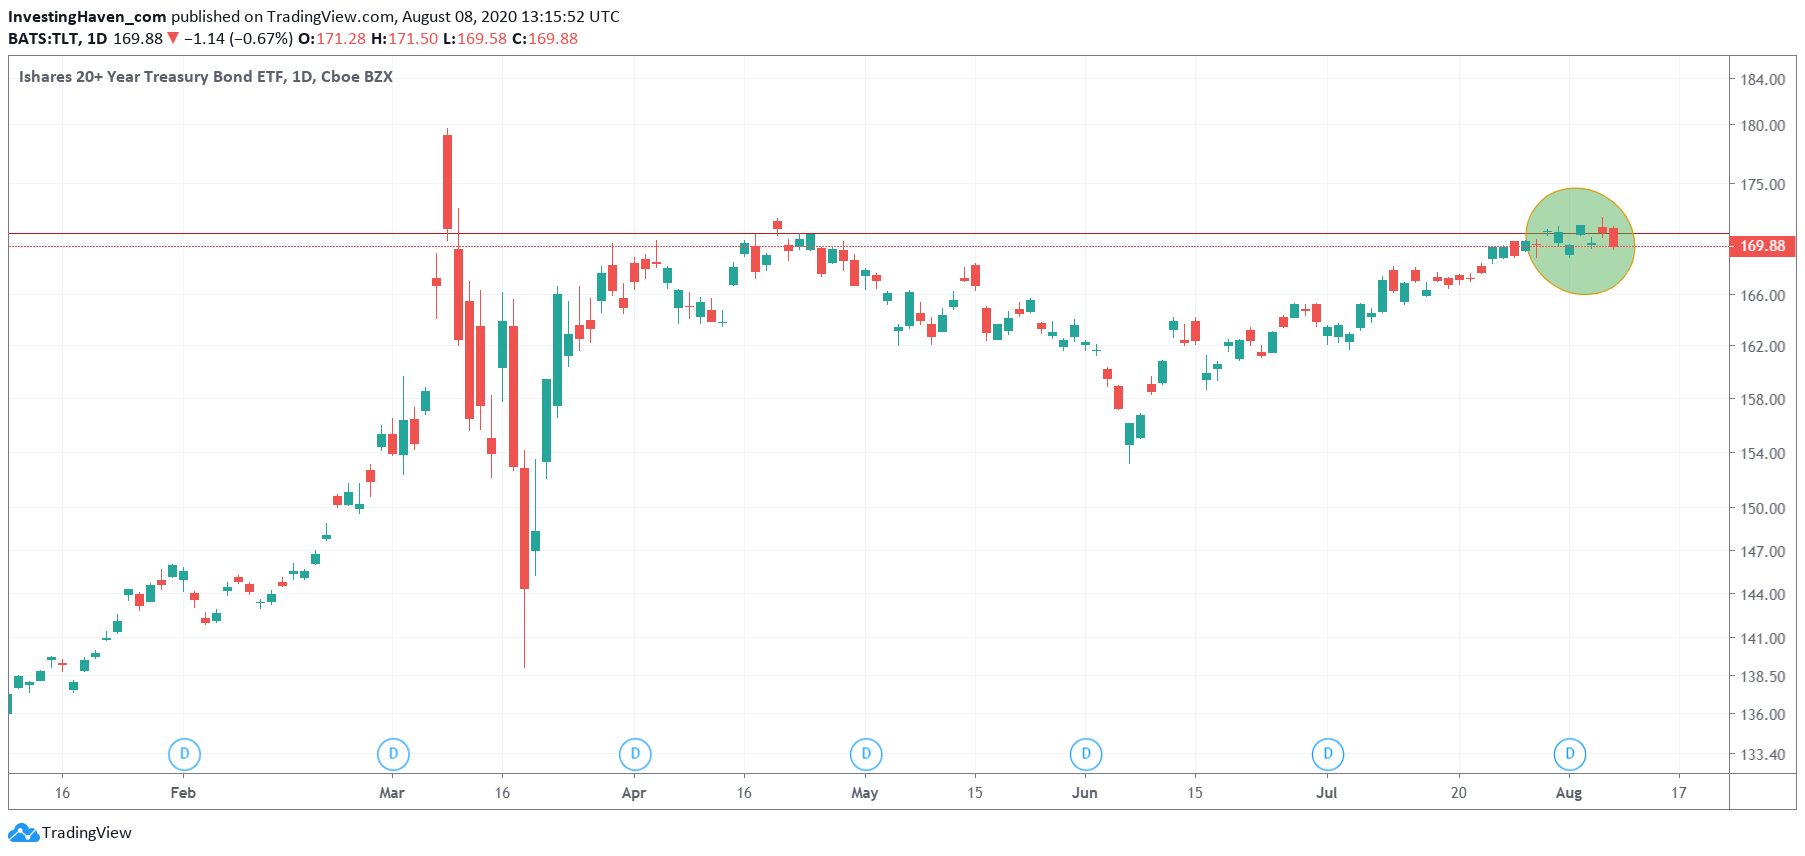
Second, 20 year Treasuries.
Obviously they reflect the opposite of rates. But it is worth checking both charts simultaneously, as it sometimes helps to better see some trend on one of the two charts.
Same conclusion, this market is probably setting a giant bearish double top, more than a bullish reversal. If this is true, it will indeed hurt precious metals once Treasuries start falling back to 154 points.

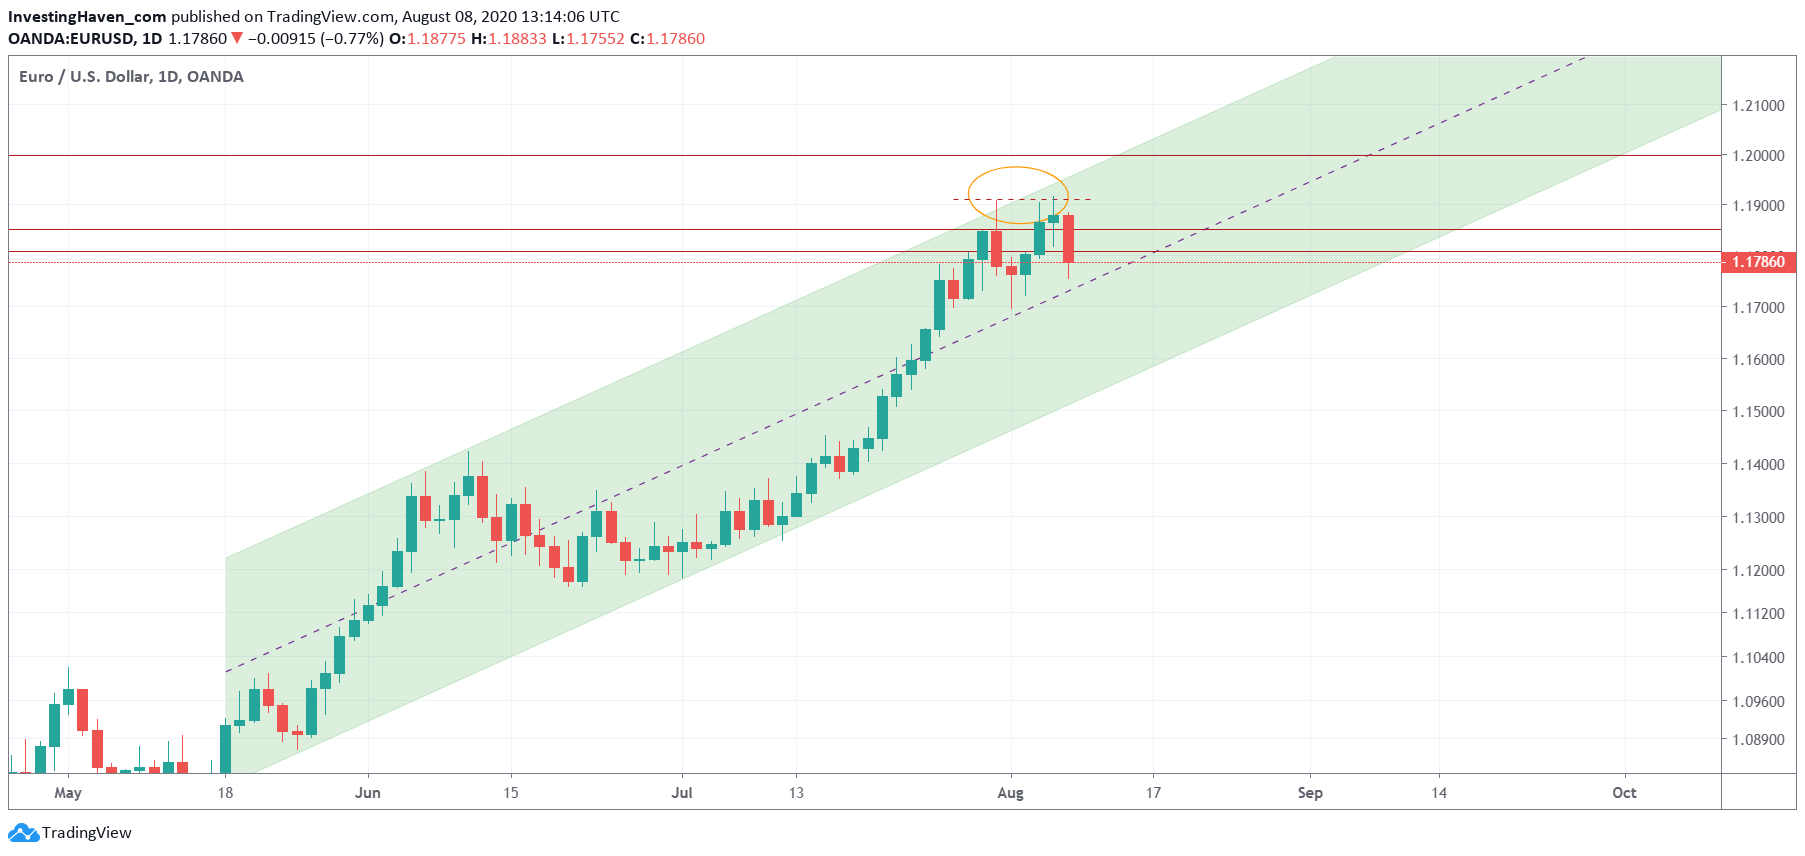
Third, the Euro chart shows a bearish M reversal on the short to medium term. This might imply a sideways move, maybe a pullback, in the Euro. This is not good for precious metals in the short to medium term.

We believe all these charts confirm each other, and they suggest precious metals need some time to recover from their recent ultra fast rise.
Ultimately, precious metals will continue to rise, pretty sure about this. The ultimate top in metals is not in, as of yet.


