Gold had 2 very rough months: February and March. Our gold forecast and silver predictions suggested that the gold market would turn bullish in the 2nd half of the year, as intermarket trends would not be supportive for precious metals in the first part of the year. While we don’t know what the 2nd half will bring for the gold market we do know that the first half of 2021 was weak and about to turn neutral, exactly as predicted.
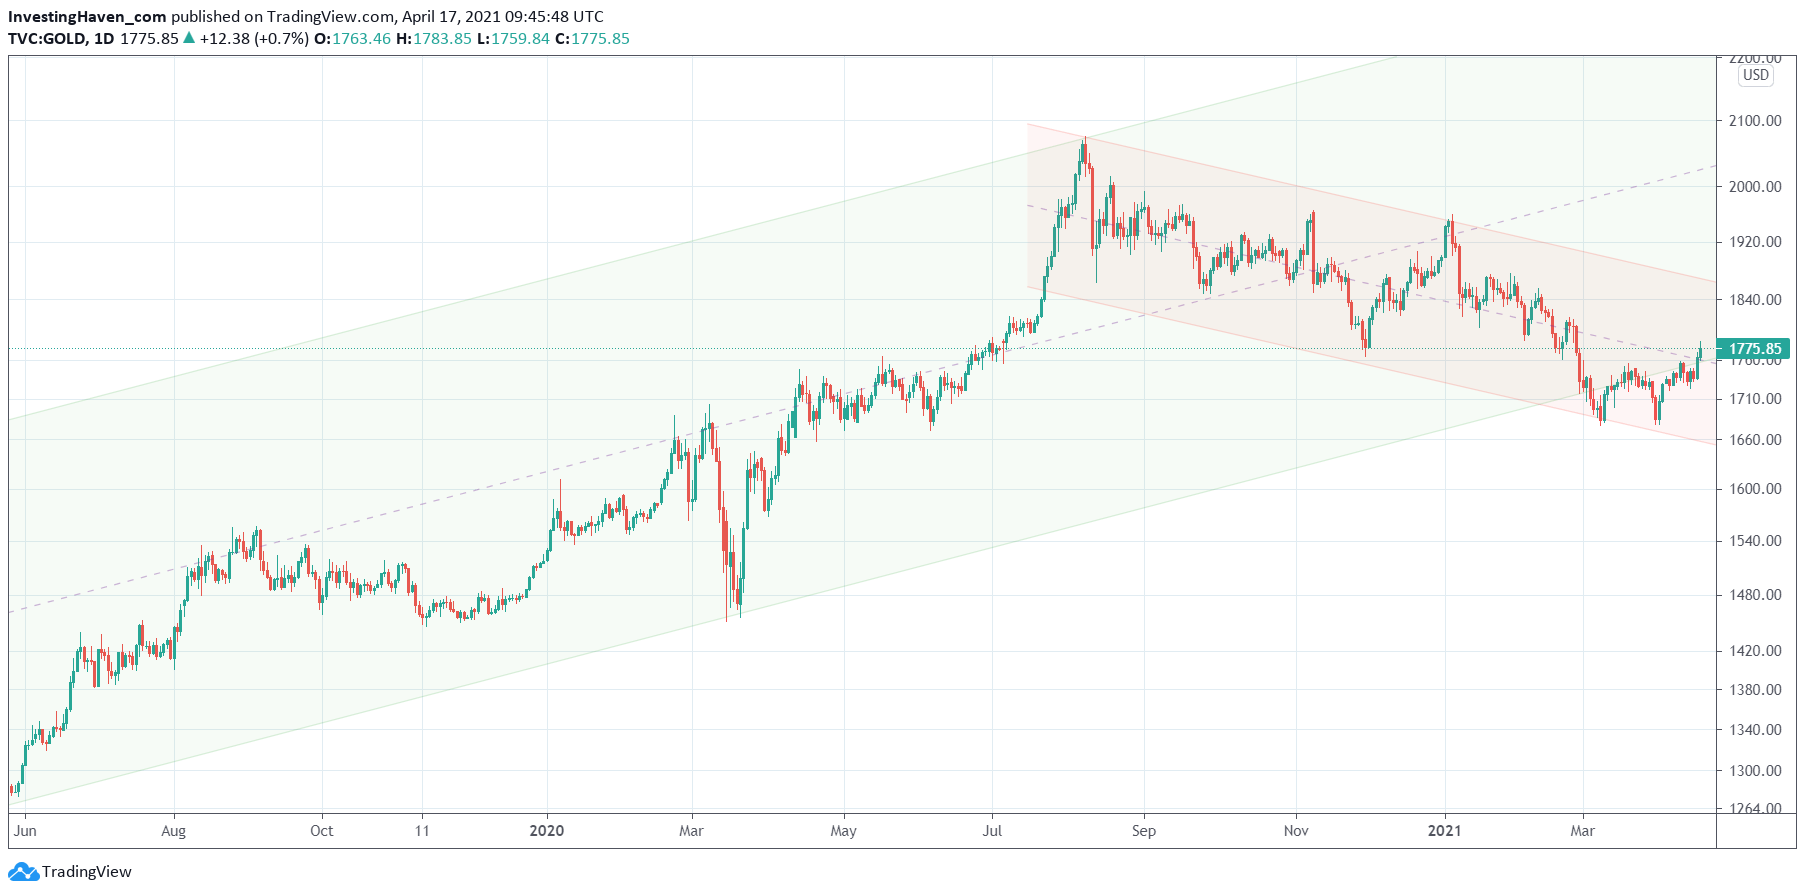
There is one simple chart that makes the point about the entire gold market which includes gold, silver and precious metals miners. It’s the daily chart in this article.
We see two trends on this chart.
First, the secular bull market that started in June of 2019. That’s the trend represented with the green rising channel. A powerful uptrend that started 2 years ago, saw a big drop during the epic Corona crash sell off, and continued its rise only to set a major top in the summer of 2020.
Second, the tactical bear market that started after gold set a major top in the summer of 2020. See the red falling channel on the chart.
What’s interesting is that gold fell below its channel in the month of March, and it did so twice. It was not justified to enter a gold position in March, from a risk management perspective. What we also observe is that a bullish reversal was printed in the month of March.
While gold is back in its secular bull market now (green channel) it still is in its red falling channel.
Combine this gold chart with the insights shared in Leading Global Risk Indicator Trying To Turn Bullish In April and we have a very clear path and conditions which will inform us about gold’s intentions to turn bullish.


