Gold went up too fast, anyone can see this conclusion by looking at the chart. A healthy pullback started on Friday, it was to be expected. Not only that, we also believe it will be a healthy pullback, one that will improve the long term profile of the gold chart. This should enable gold to clear ATH sooner. Note that the gold market is perfectly tracking our gold price forecast 2023; it might even exceed our expectations if this coming pullback turns out to be bullish reversal continuation in which case silver will be the precious metal to buy.
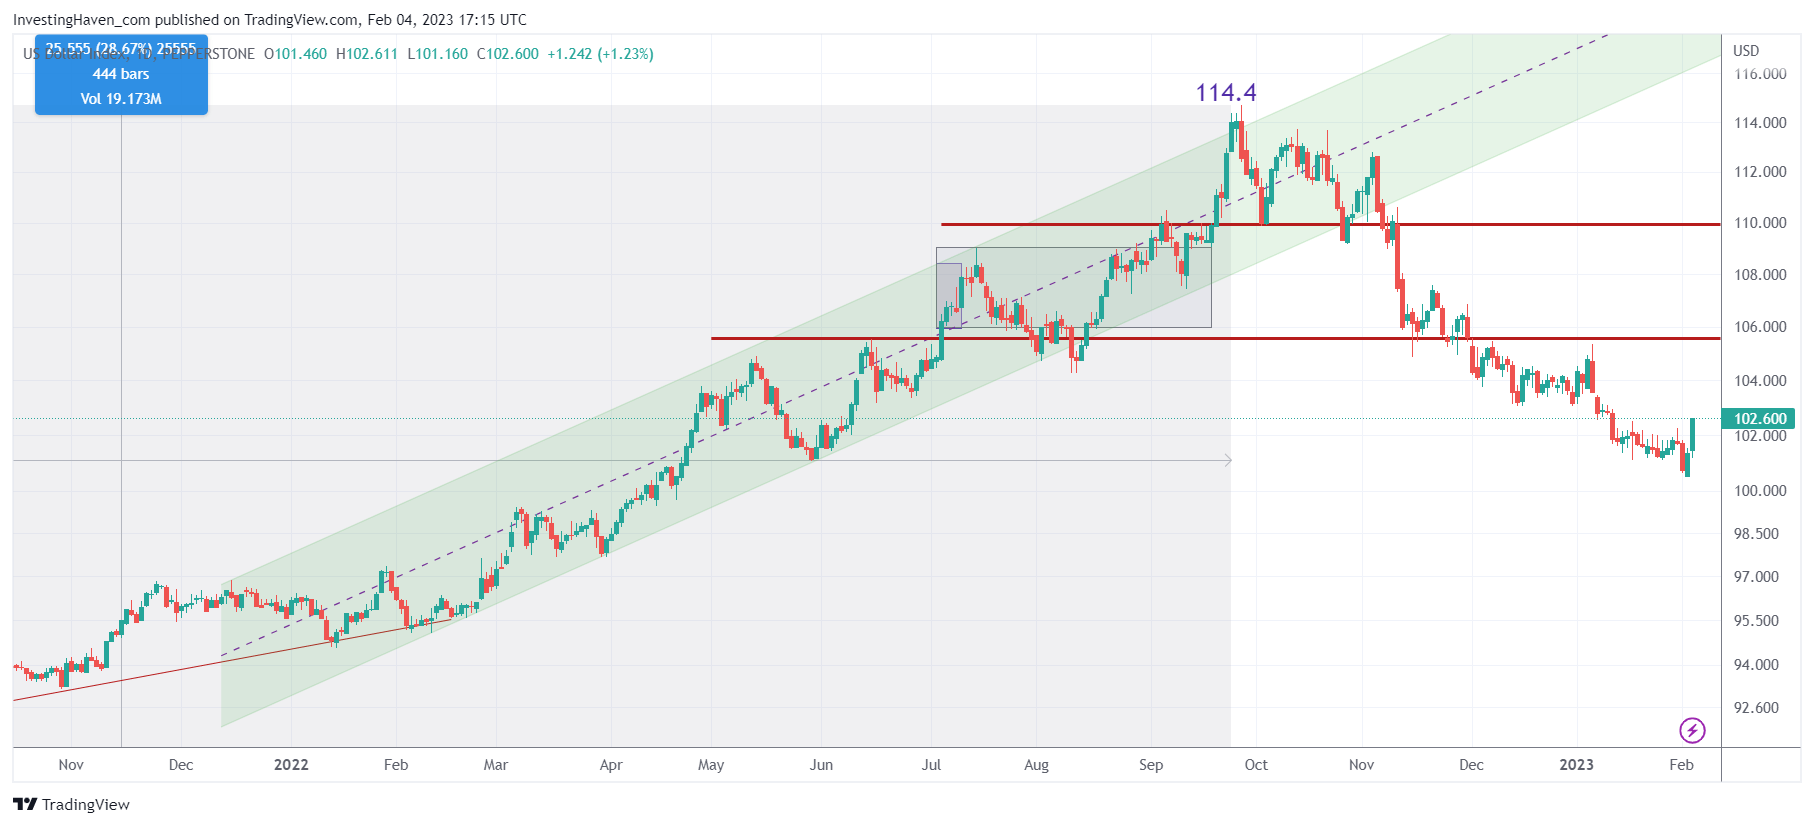
The U.S. Dollar chart says it all: a bounce in the USD is the most likely outcome here, we can easily see a move in the USD to 106 points, maybe even 107.7 points.
Needless to say, this will put pressure on gold as well as other commodities.
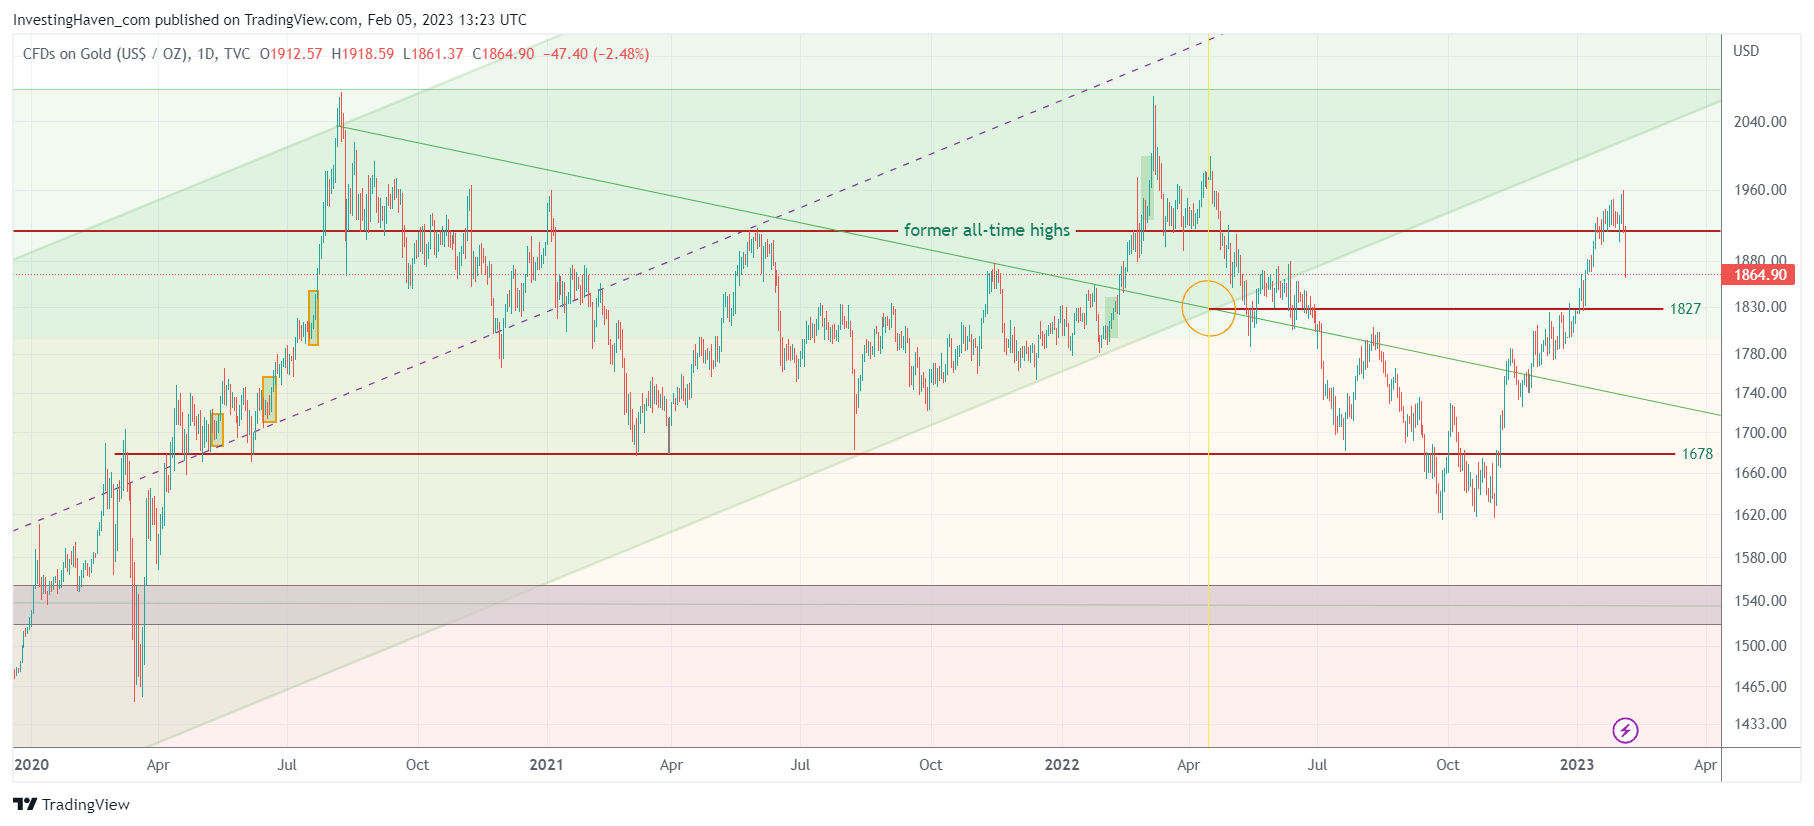
Gold went to 1960 USD/oz, which is right at the former ATH (Sept 2011). It was the 3d attempt to clear ATH, since 2020. The previous two failed, as we know by now, but the rally of the recent attempt stalled a little lower. This is not good or bad per se, what is much more important will be where the pullback will find support.
Support readings are much more important than resistance readings.
With that, let’s look at support candidates on the gold chart:
- The most bullish outcome would be if gold will find support in the 1770-1820 area.
- A potential intra-day dip could bring gold to 1740 where good buying should come in.
- Ultimately, we need to see a consolidation at or right below 1827.
These 3 conclusions are obvious by looking at our annotations on our chart. If these 3 conditions are in place, by mid-March, we believe this pullback in gold will dramatically improve the long term profile as it will qualify as a bullish reversal continuation pattern.
RECOMMENDED READING: Silver: 4 Structural Changes That Confirm The Start Of A New Secular Bull Market.


