Buy low sell high. One of our 100 investing tips, likely THE 4 most profitable words for investors. Likely, also the 4 most challenging words for investors. In order to buy low you have to take positions when literally nobody is looking into a market. That feels very, very uncomfortable and unnatural. But it’s the recipe to success, and giant profits! The sector that is extremely undervalued right now is the precious metals miners stock sector. The precious metals miners chart has the most awesome chart setup. It may or may not happen anytime soon, but if “it” happens we will see a giant breakout. We watch our gold forecast and silver forecast, and are ready to increase holdings in First Majestic Silver as per our forecast (AG) because it is our top silver stock.
Precious metals prices were rising last week. One day does not make a market, but it should attract the attention of investors!
Precious metals miners: leading indicators
We will not look into the fundamentals of the precious metals sector because we talked about them extensively in all our forecasts. The leading indicators are the Euro, the Commitment of Traders report and real rates.
- The Euro seems to be setting a bottom, in the form of a falling wedge.
- The COT report suggests more upside potential than downside potential in gold and especially silver prices.
- Real rates are improving with fast declining Treasury rates combined with explosive breakouts in inflation expectations.
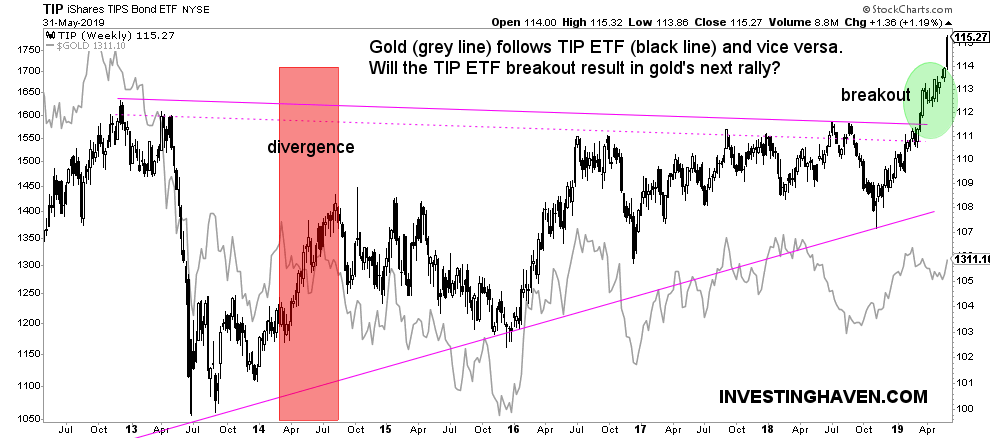
Interestingly, the last point we mentioned, inflation expectations, is going through a giant breakout! Make no mistake, this is major news. Most likely, fast falling rates result in rising real rates which is the rationale underpinning rising inflation expectations.
As the first chart suggests rising inflation expectations are strongly correlated to the price of gold (in the last 6 years). There was only one divergence between both assets that lasted a few months (mid 2014).

Which brings us to the most awesome chart setup of 2019: precious metals miners.
Precious metals miners: an awesome chart
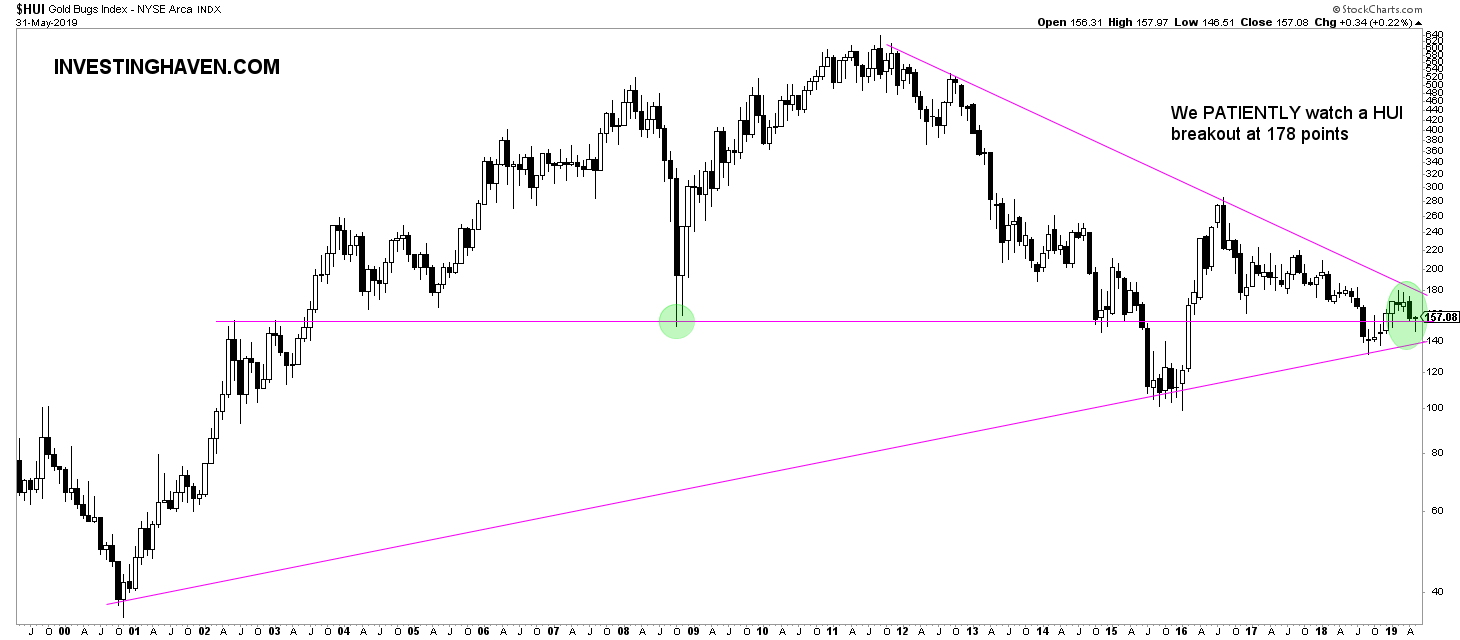
The gold and silver stock sector has been horrible since 2011 with the exception of 5 months in 2016.
Interestingly, precious metals stocks are back at their 2008 bottom, one of the few sectors that is trading as low as the depth of the financial crisis.
The picture for us is quite clear: this sector is so beaten down that a small rise will trigger a giant breakout. The second chart below makes our point. It requires no comment.
What’s the big risk for investors? Buying too fast, selling too fast, buying to aggressively, selling too aggressively.
The chart below, combined with the leading indicators mentioned above, in the current environment in which broad markets are struggling, should trigger the need to slowly but surely accumulate. Precious metals stocks may rise anytime soon, for sure if they break out. But it may take another 6 or 12 months.
So the question is how to bridge this period?
The only answer is slow accumulation as long as the picture looks promising, acceleration after a (confirmed) breakout and selling after a (confirmed) breakdown.
In other words, follow the pulse of this market. Don’t go too fast, don’t miss the train neither, slowly but surely accumulate the top assets like First Majestic Silver.
Once this sector breaks out it will go fast and steep in one direction (higher). You want to be already in there, and only add to your positions. But you also want to give yourself and the market time to prove the direction it wants to go!


