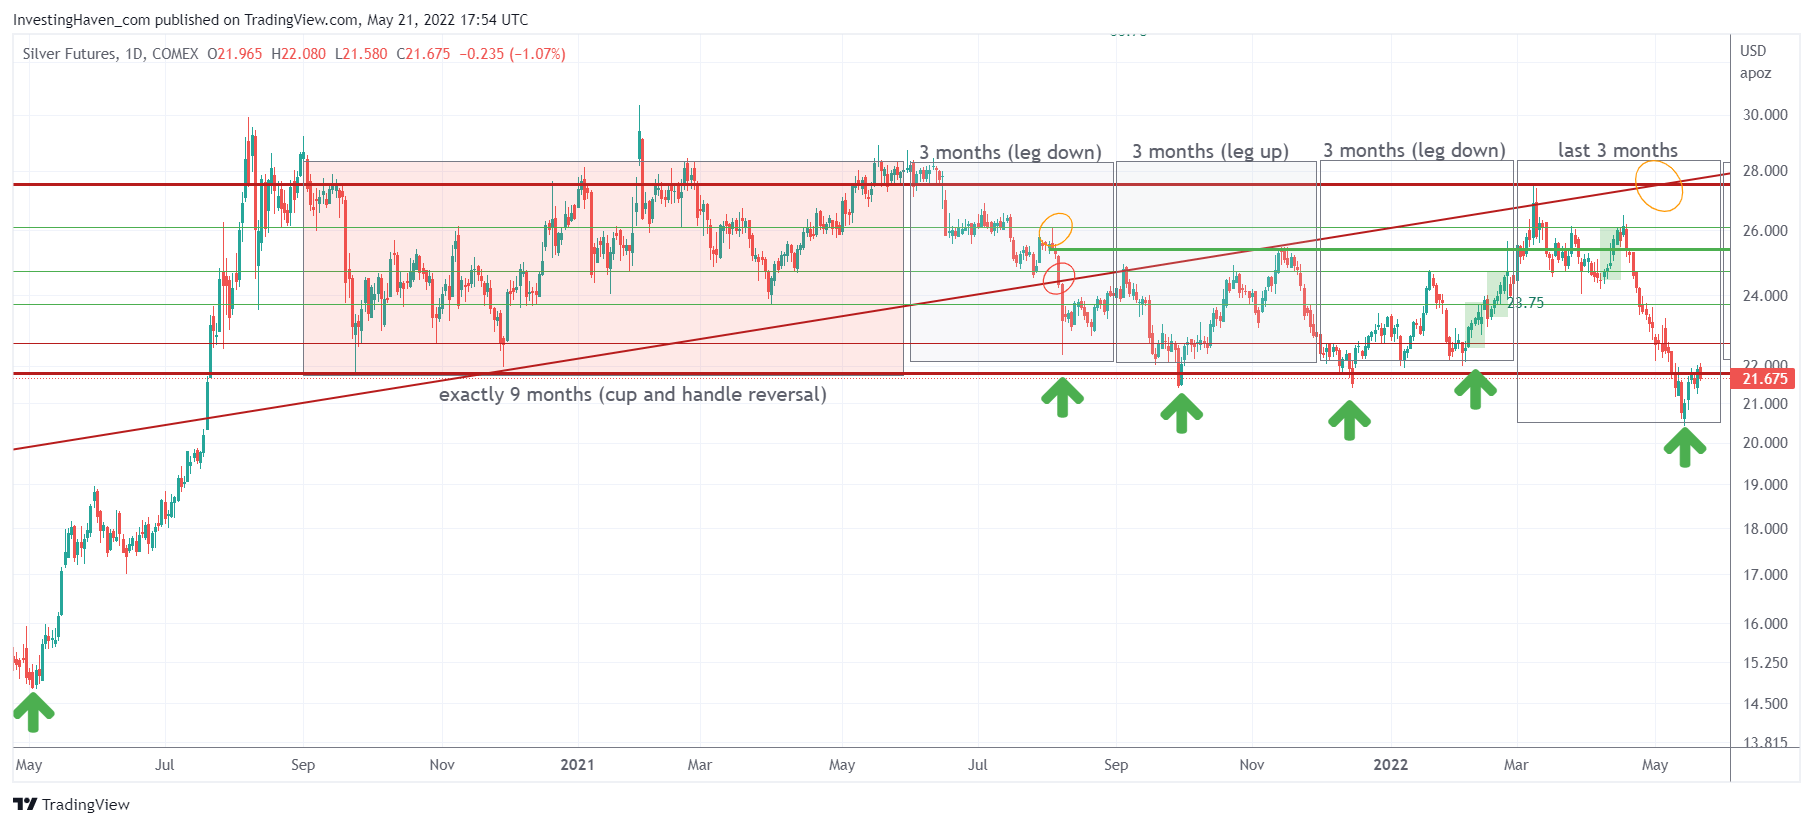
The long term bullish reversal is still in play on the silver chart, although thoroughly tested. The silver price chart has a double W reversal over nearly 2 years. As long as current levels hold, this could and should be a price point from which an accelerated move higher can start. Yes, our silver price forecast is still in play.
Five tests of key support in some 9 months. That’s what silver is going through now. There is no confirmed breakdown.
The silver chart is now turning into a really special, fascinating chart. There are quite some deep insights we can get out of the silver chart:
- The cycles are there, clearly visible, consistent.
- The current cycle started with a very strong move to the top of the range, some 2 weeks after the cycle started. Some 2 weeks before the end of the cycle, silver moved to the bottom of the range. We can reasonably expect silver to move towards 23 USD by the end of this month (also cycle).
- The green arrows which we did indicate are crucial, absolutely crucial. They coincide with very bullish signals in one of silver’s leading indicator (the futures market positioning).
Although not visible on the chart, we can say that silver’s leading indicator (the futures market positioning) is the most bullish in many years. In fact, it’s as bullish as when the 7 year bear market came to an end, right before the summer of 2019.
Moreover, other leading indicators of silver (USD and TNX) seem to be topping. Once confirmed, we are sure that silver will fly.
Yes, it currently looks shaky on the silver chart, it is a fly or die level. But leading indicators favor the silver price to start flying in the not too distant future.


