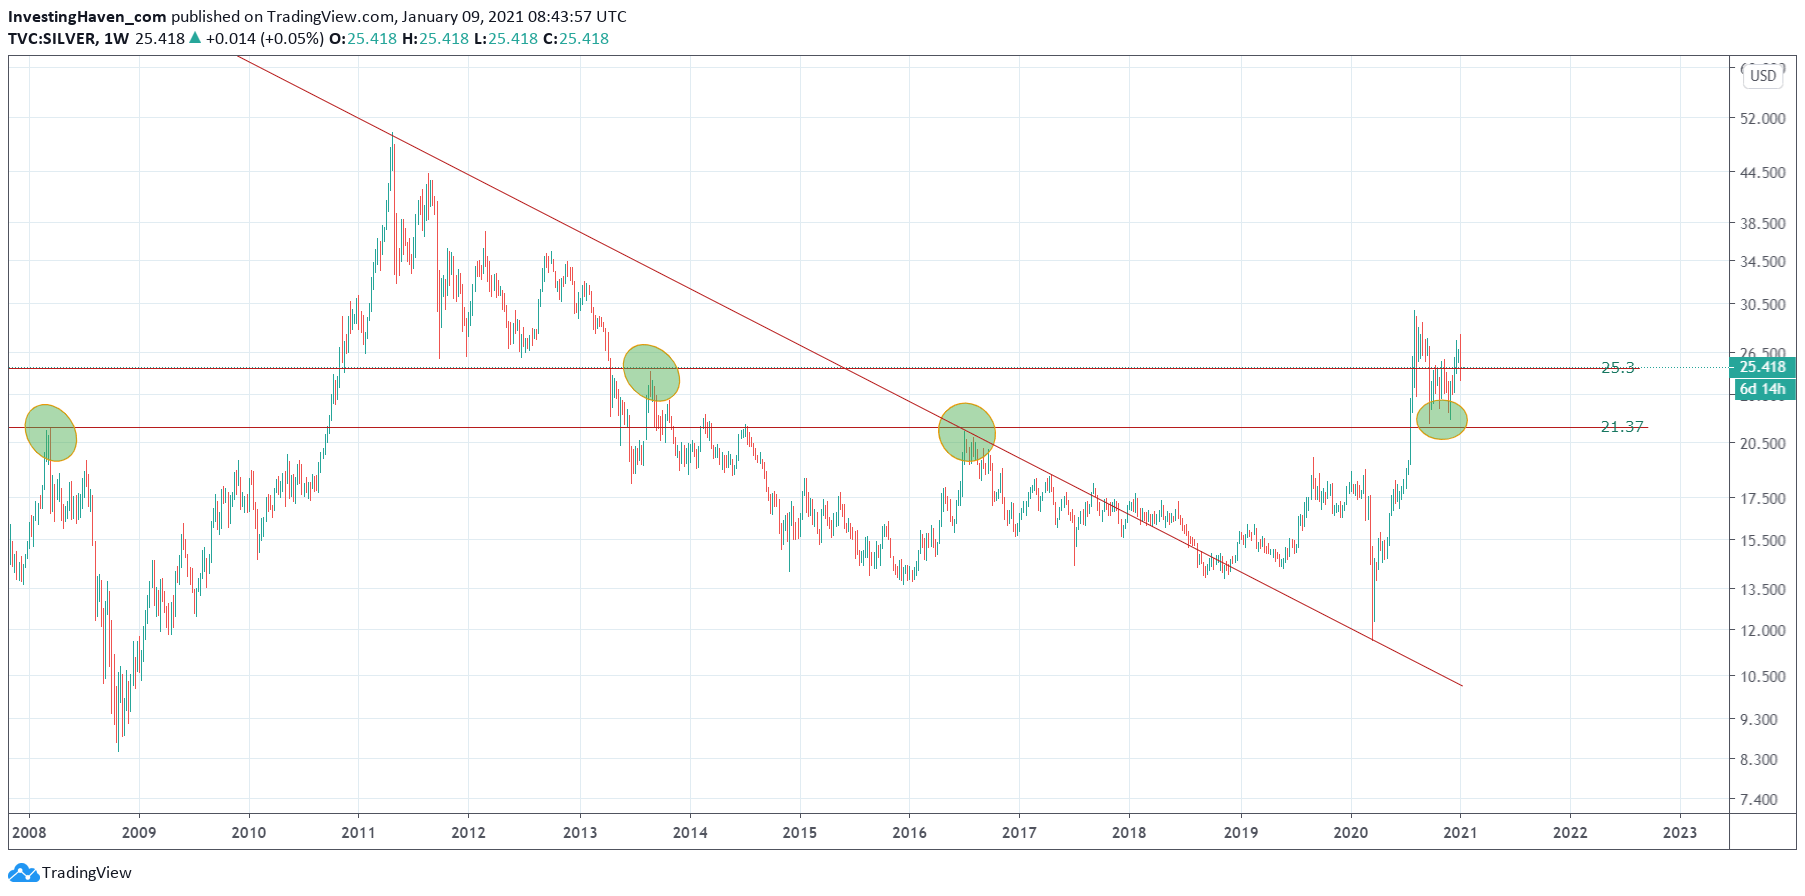
Friday’s violent drop in the price of silver created some damage, visible on the daily chart. On the weekly chart, we can conclude one thing: silver needs time, more time, before it can become wildly bullish again. Our silver price forecast 2021 is still valid, but in terms of timeframe we cannot expect bullish action in the first months of the year.
The silver price drop went as far as 10%, before recovering a little bit and closing some good 6% in red. The line in the sand for silver is 25.50 USD, and silver closed at 25.50 USD.
How much more ambiguous can this be going into next week.
We have a pretty reliable setup on the daily chart (featured in our premium research service), but we are going to focus on the weekly chart in the public domain.
What we can see is a clear attempt to break higher, but Friday’s drop stopped this cold. Silver started a move to the 30ies, and Friday’s price action postponed this (maybe, who knows, postponed it considerably).
The weekly chart shows that silver is now stuck between 21.37 and 25.30, both critical and decisive levels going back 2 decades. What this chart does not tell, is how long silver will need to overcome these levels. It also doesn’t tell if silver will drop back to the 21-22 level OR if it will consolidate around 25.30 USD.
What we do know is that this chart needs time, many more months, before it can do any magic. We are patient and eager, and we’ll allow this market the time it needs to get bullish again.


