One of the most beautiful charts out there is the one of silver. We expected this to happen when we wrote one year ago our silver forecast 2019. The million dollar question is whether it is not too late to get into the silver market. Although we covered this question in more depth in Investing Opportunities #3: Gold Market Heating Up, Get In Or Too Late we want to cover the silver price chart separately in this article. What stands out is the 3 key price levels in silver, for 2019 but more so 2020.
Our investing principles tell us to take the longer timeframes when predicting price targets in any market, which includes silver.
So let’s review the monthly silver price chart, and try to get to the question which those important price levels are. As per Tsaklanos his 1/99 Investing Principles it is just 1% of price points on any chart that do matter!
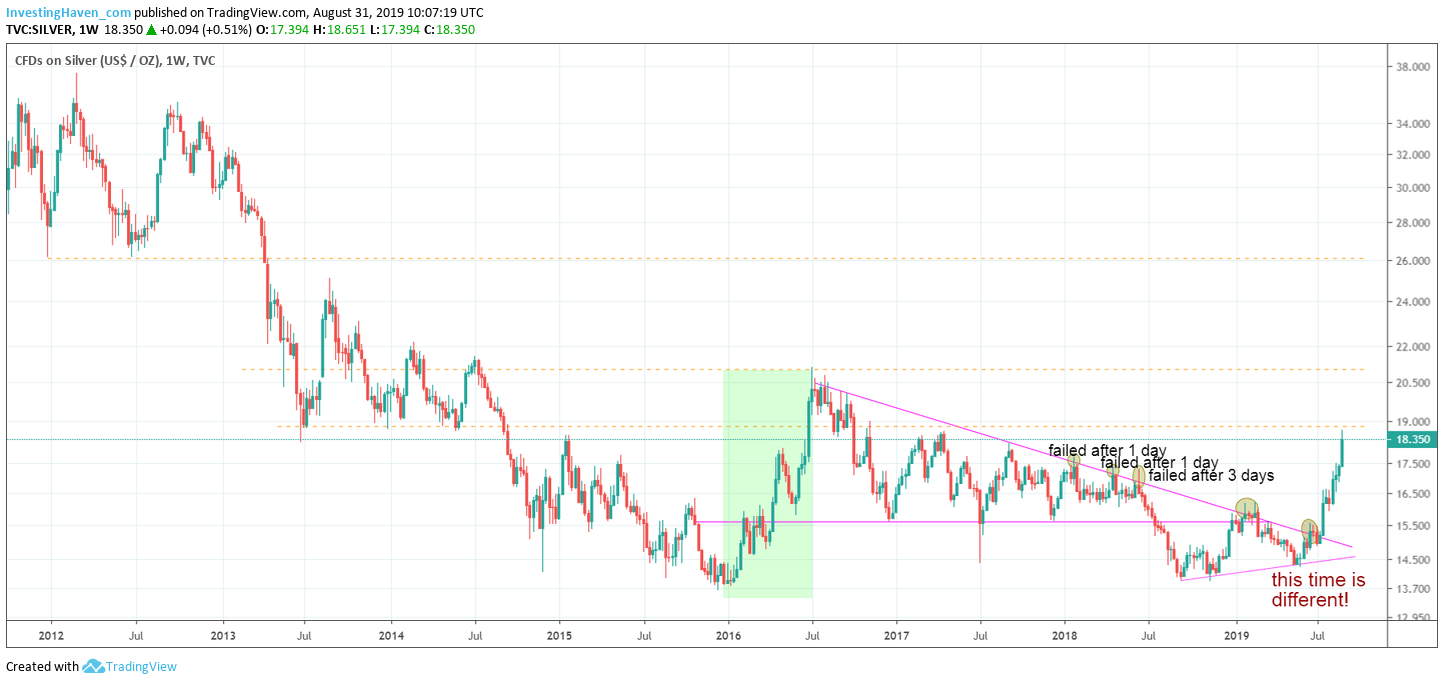
On silver’s long term chart shown below we see a few important conclusions.
First, there is something like a major rounding bottom visible on the chart. The rounding bottom started in June of 2013, right after the major crash of precious metals. The mid point looks to be set in between the major double bottom of 2016 and 2018, somewhere around July 2017. If this rounding bottom is indeed the dominant pattern we may expect this formation to conclude in June of 2021 in the 25 USD area.
Between now and then, we may see moves to the upside as part of the bullish rounding bottom.
In particular we see 3 price levels indicated with dotted yellow lines: 19 USD, 21 USD, 26 USD.
What does this mean?
We believe we will see a few attempts for silver to march higher. We also expect serious resistance at those 3 price points.
Any break above those price levels will pave the way to move to the higher price point.
Patient investors are happy to wait it out until 26 USD is met, most likely in the next 24 months!


