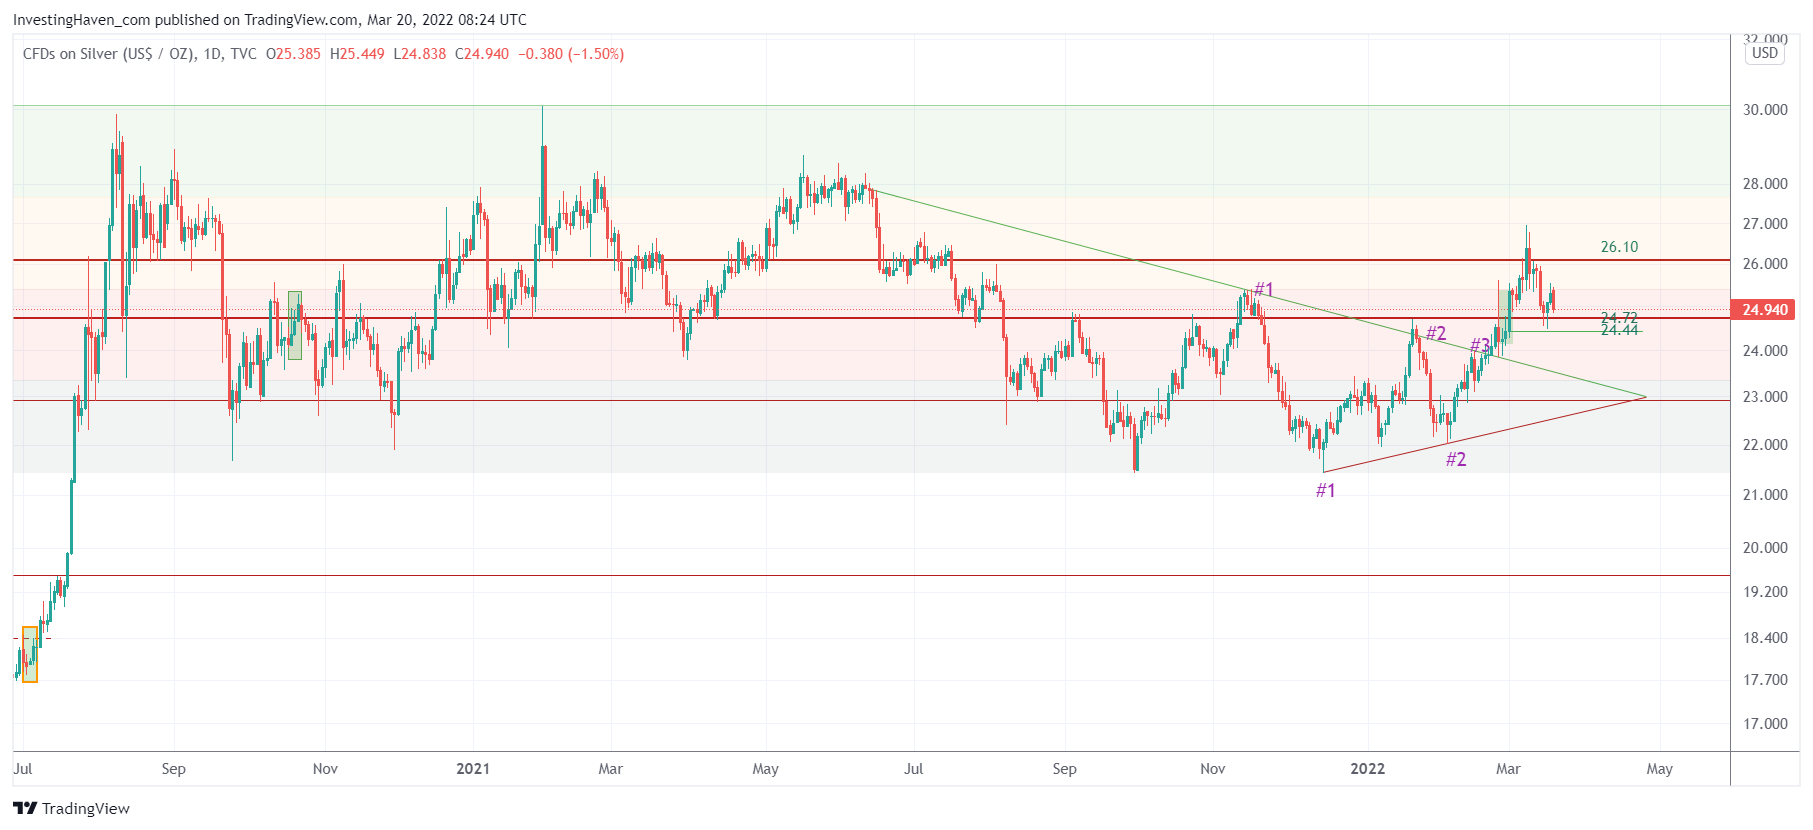
Silver hit 27 USD, some two weeks ago. It is clear that resistance was too strong and a secular breakout was not possible. Moreover, the February rally was too steep, it was not sustainable. Our silver chart has a very simple message, it is a bullish one and it also suggests ‘patience’.
We feature a really unique silver chart in our premium services, one which combines time and price analysis. It has proven to be very accurate.
In the public domain we have the price focused chart which is helpful but not as rich as the one from the premium services.
That said, the price focus silver spot chart has a very clear structure: a W reversal that started last year June. That’s a very bullish long term setup, as said many times.
In terms of price, not timing, we see that 25.20 is the ‘hurdle to overcome’. It will take some time to overcome this, for two reasons.
First, the recent rally was too steep. Silver needs to create a mini-reversal pattern in which it will probably test the 23-24 area. This will allow silver to gather strength and prepare its move to 28.
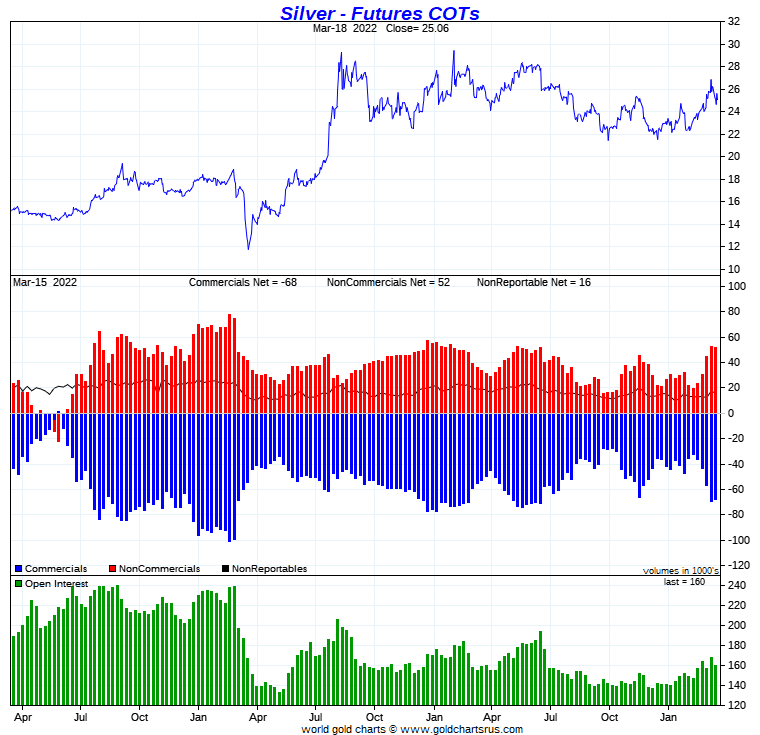
Second, the stretch indicator as per silver futures (CoT report) suggests that short term upside potential is capped. The blue bars, on below chart, courtesy of Goldchartsrus, representing silver net short positions of commercials (typically banks) has grown too much too fast. This is a stretch indicator which means that price is most likely going to find resistance until net short positions of commercials come down.
Silver is taking a break, and it’s a break it needs to gather strength. It is a break that will allow silver to prepare a secular breakout. The break before the breakout attempt, how does that sound?


