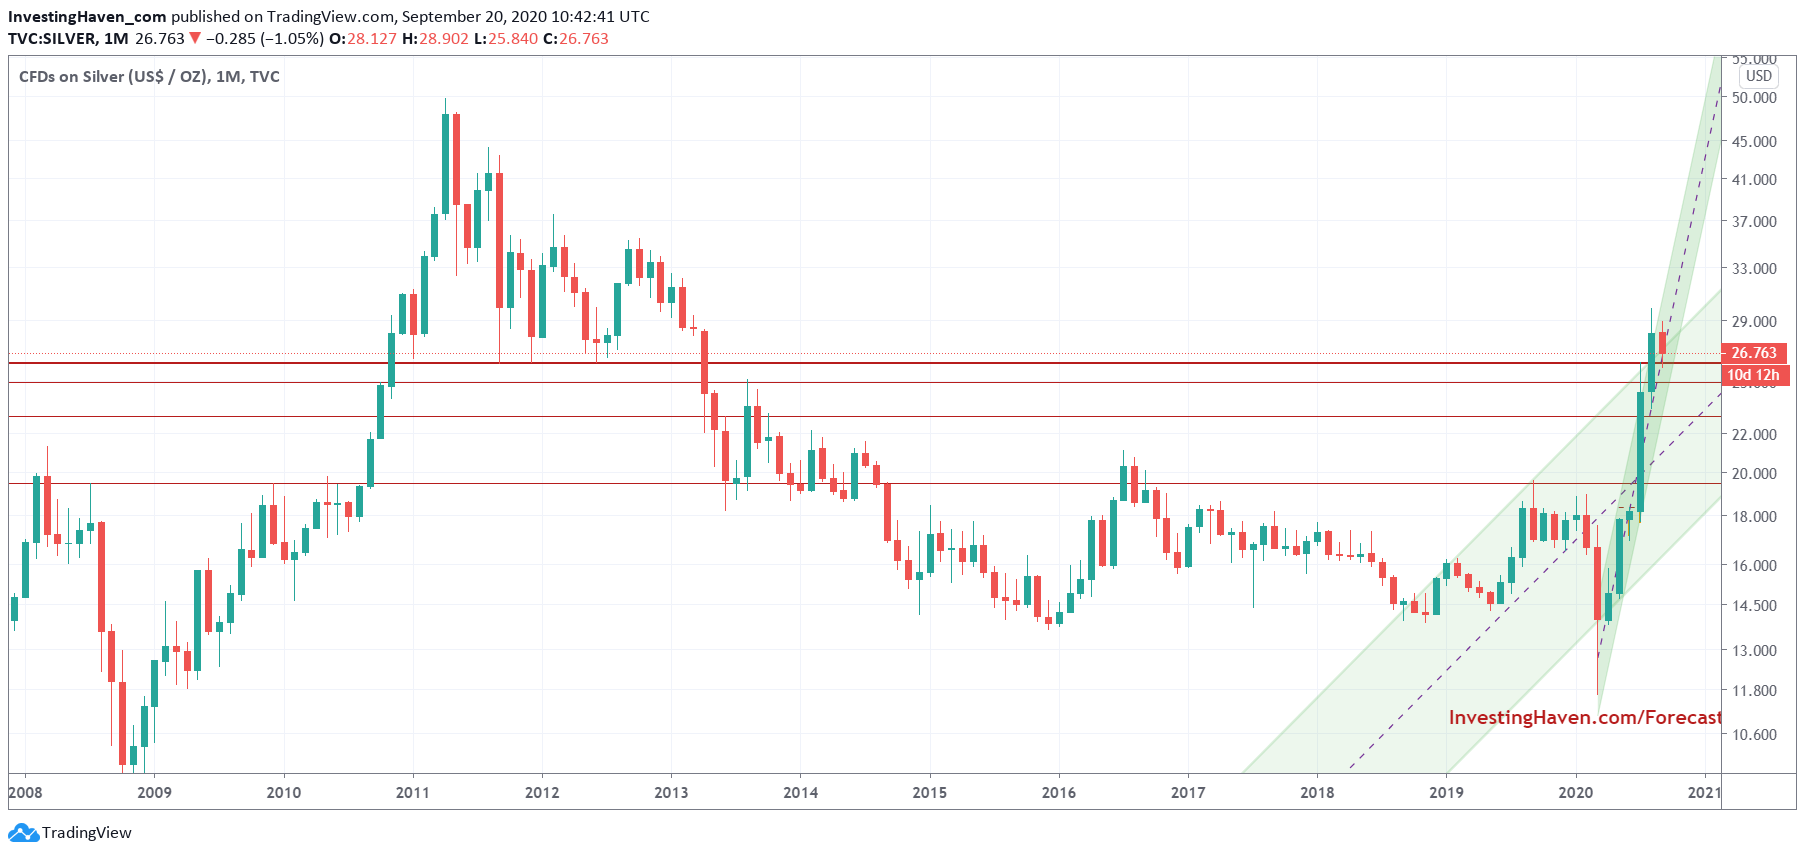
Silver’s long term chart is simply spectacular. Absolutely special setup, really unique and it won’t occur often in a lifetime to see this setup. The silver price may really crush our silver forecast for 2021 if silver refuses to move lower.
Below is the monthly silver price chart.
This chart is phenomenal.
It has a giant bullish reversal pattern, one that spans over +7 years. It started with the breakdown in March of 2013, and it completed last month.
We won’t see this type of setup again, presumably, in our life times. We are living in special times.
Now how can this play out? It is one thing to look at the past, it’s another thing to try to understand future price action.
It is pretty simple in the case of silver. Look at the solid red horizontal trend line around 26 USD. We have one month of price action above it. As long as silver remains above this level we know it is consolidating and preparing a move higher (not lower).
So far silver has shown appetite to stay above 26 USD. The longer this goes on, the higher the probability that silver goes higher in the medium term.
Is a test of 50 USD possible?
Anything is possible in financial markets. We wouldn’t say it has a very high probability, but price action in the next few weeks and months will reveal whether we may see 50 USD in silver any time soon.


