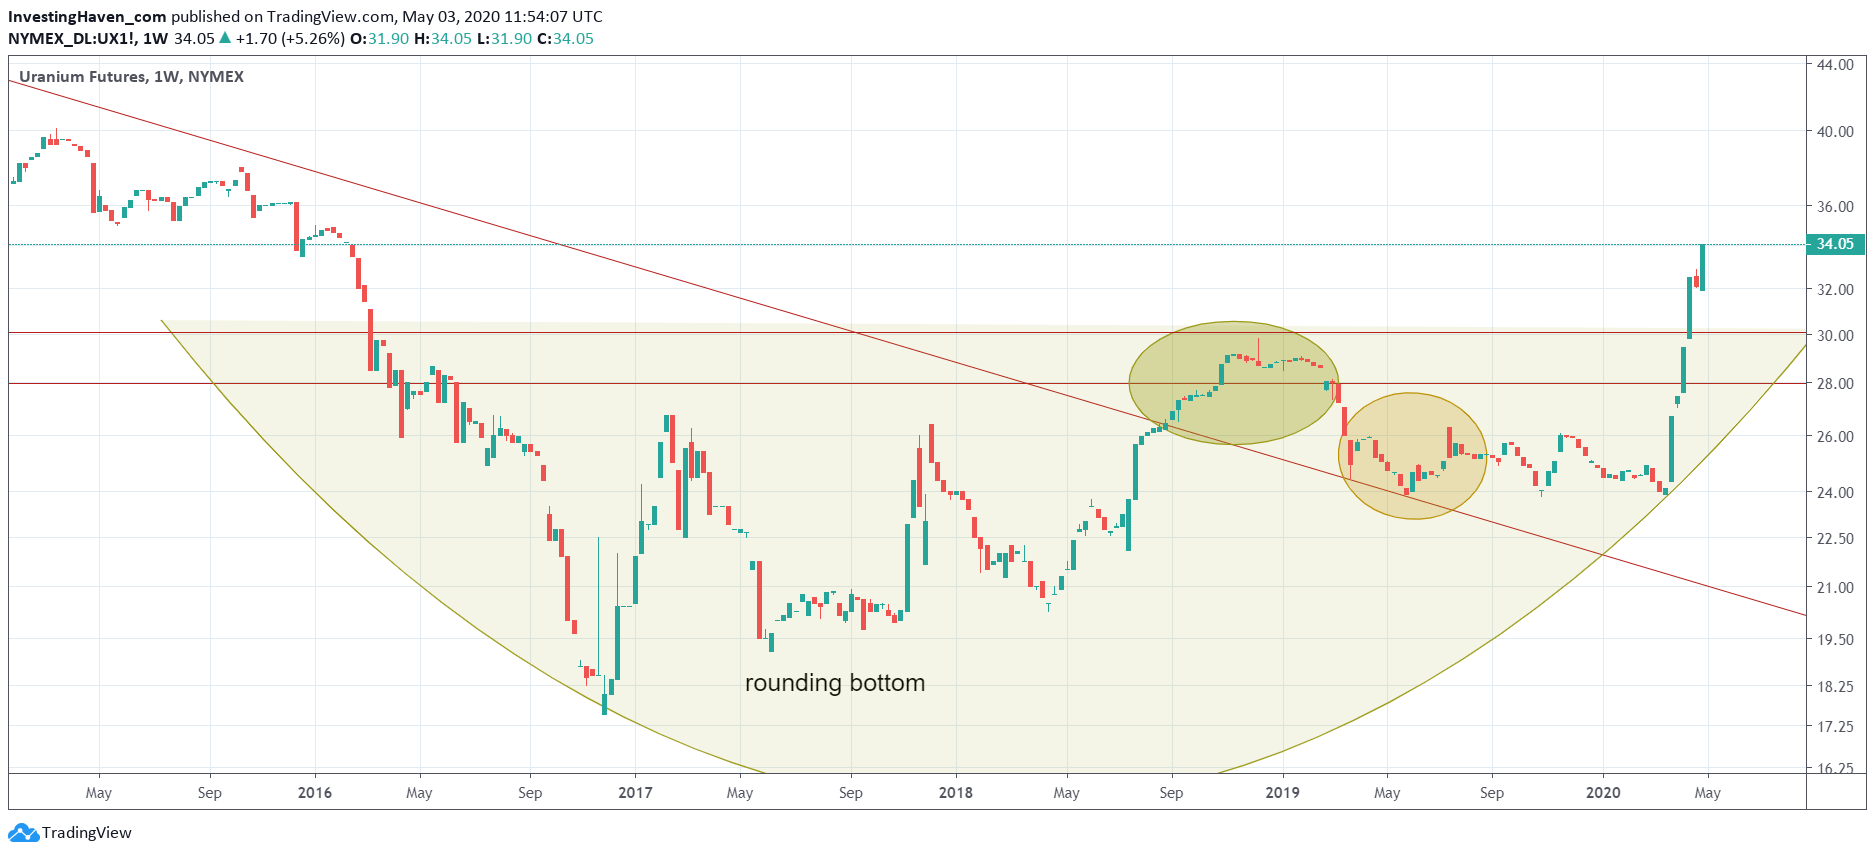
It was one week ago when we wrote about the uranium market: Uranium Price Explodes, Is This A New Bull Market. The uranium price popped about its long term breakout level at 30 points, started consolidating around 32 points … and this week it continued its breakout. This is one of the most powerful charts we have seen in a while. Is this worth an investment?
Really impressive, are the only words we can use for what we see on the uranium price chart.
The first intuitive reaction of any investor with an interest to get exposure in this space is to look for the news to understand ‘why’ this is happening.
Whatever the news, stories, articles, tweets we may find about the uranium market they are all irrelevant. Let’s rephrase this: 99% of all those materials are irrelevant, you have to work hard to find the 1% of relevant content, per our 1/99 Investing Principles
In the end does it matter?
All that matters is the price chart, and only price is relevant.
The uranium weekly chart on 5 years has a giant reversal pattern which is really ‘perfect to the pixel’. The breakout looks to be confirmed now, it requires one more week above 31 points for a confirmation.
Interestingly, the uranium mining stocks don’t show similar breakout patterns. They fell victim of the Corona crash. In order to understand if the uranium space is interesting to invest in we investigate all uranium miners to understand if a position is justified particularly in our momentum investing portfolio. We don’t have the answer to this question yet, but it will become clear in the next few days and weeks.


