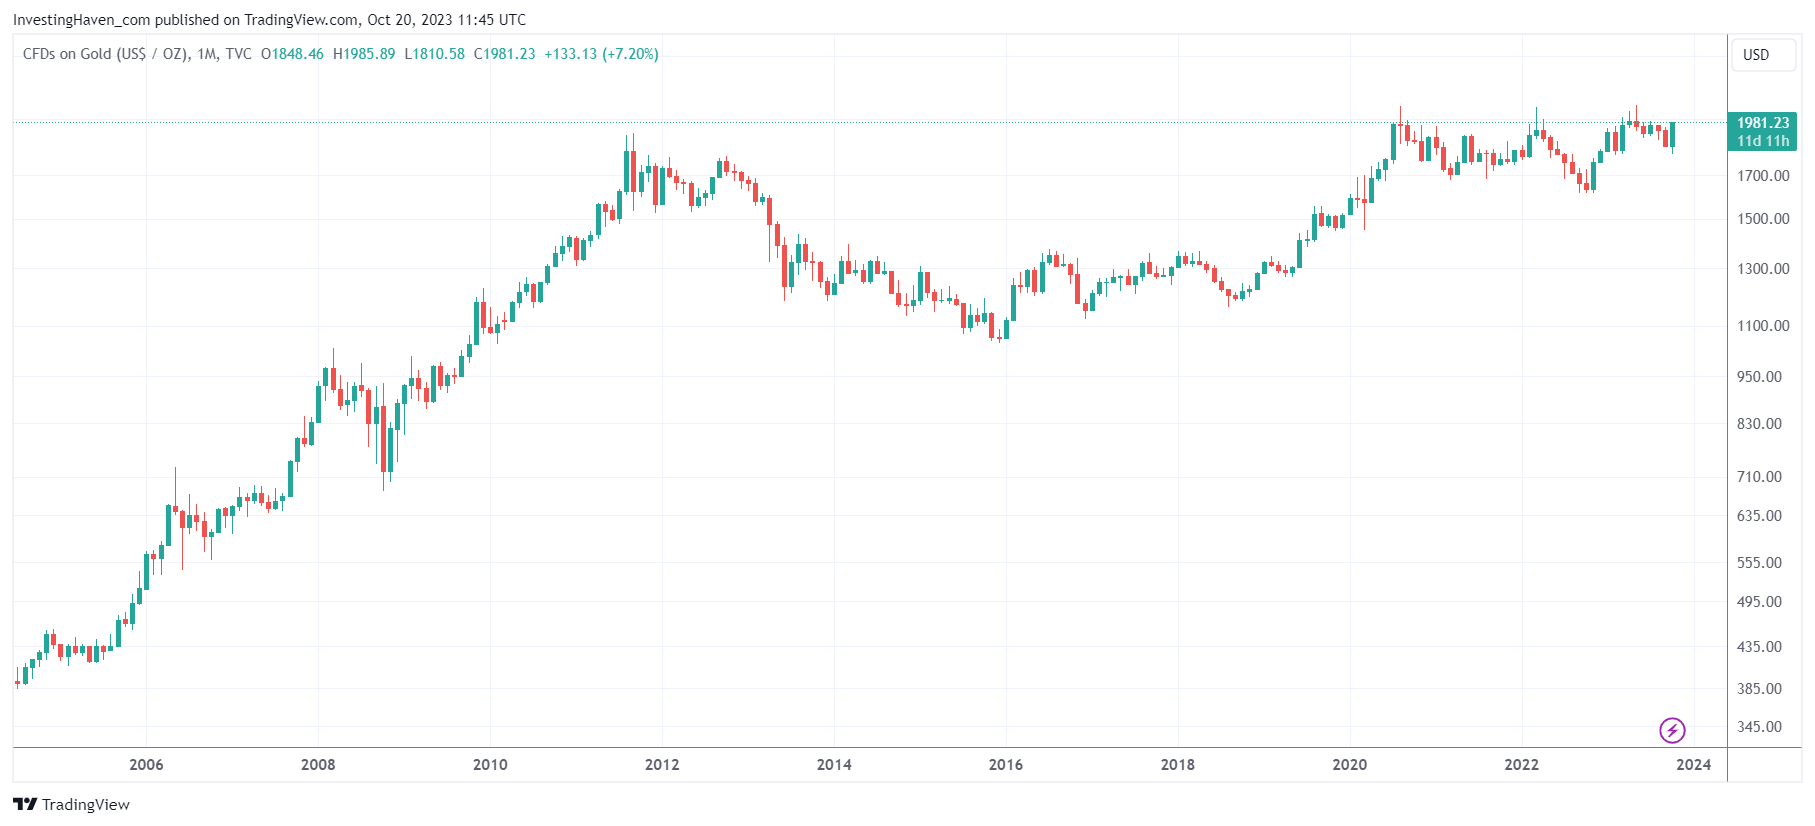
Gold has maintained a steady rise throughout 2023. Despite its occasional consolidation phases, the underlying trend for gold is growing increasingly bullish, as indicated by its pattern of establishing higher lows. This is consistent with our view as explained in Is Gold Expected To Move Higher And Set New All-Time Highs? As we explore the intriguing dynamics of gold’s performance, one prominent feature on the horizon is the triple top formation in gold prices. If gold can successfully break through this resistance, as per our gold forecast, it will be an essential milestone on its path to higher values.
The gold chart, at this moment, can be likened to a pressure cooker. The key to unlocking its potential lies in surpassing its highest monthly closing price, which stood at 1989.62 USD/oz in spot gold in April 2023. Once gold manages to breach this critical level and achieves a monthly closing price above it, the path appears to be clear for gold to make its ascent towards the 2200-2500 USD/oz range.
Note that this gold price analysis is very much focused on the long term gold chart, and should be complemented with gold’s leading indicators for 2024.
Gold’s Strong Performance in 2023
Throughout 2023, gold has demonstrated remarkable strength, even during periods of consolidation. This ongoing upward trajectory stems from its capacity to sustain higher lows. As any seasoned investor knows, this pattern is a telltale sign of a bullish trend in the making. It underscores the metal’s resilience and showcases its potential to emerge stronger from each consolidation phase.
Gold’s Triple Top Formation
One of the most intriguing aspects of gold’s 2023 journey is the triple top formation. This formation occurs when the price of an asset hits a particular resistance level three times without successfully breaking through. Each touch of the resistance serves as a testing ground. The question is whether the asset can muster enough strength to overcome this formidable barrier. In gold’s case, the triple top formation presents a key challenge that the precious metal must conquer.
Crucial Interplay Between Gold and Yields
To understand the dynamics of gold’s price movements, we must consider the impact of interest rates, specifically yields on government bonds. Gold and yields often have an inverse relationship. Rising yields tend to put pressure on gold prices, making it challenging for gold to make significant gains.
Yields play a pivotal role in the triple top scenario. In essence, for gold to break above this resistance, yields must cease their ascent. If yields continue to rise, gold’s triple top challenge becomes more formidable. Conversely, a drop in yields, or even a period of stabilization, creates a more favorable environment for gold to break free.
Gold’s Potential
The pressure cooker analogy for gold’s chart comes into play when we discuss surpassing the highest monthly closing price. Hitting a new high above 1989.62 USD/oz is a significant milestone, one that could potentially trigger a strong upward movement. Breaking through this level would signify that gold has overcome the triple top formation, opening up a path to explore higher price ranges.
In this scenario, analysts and investors alike would be eyeing gold’s potential to reach anywhere from 2200 to 2500 USD/oz. However, reaching this range is contingent on gold’s ability to escape the confines of its current consolidation phase and make its ascent. While the pressure cooker simmers, all eyes are on whether gold can harness the strength required to break free.
The Monthly Closing Price: A Pivotal Indicator
Monthly closing prices are pivotal in assessing the overall health and potential of an asset. They provide a broader perspective, helping investors identify trends and critical levels of support or resistance. For gold, this indicator is particularly essential in its journey to break the triple top formation.
Gold’s highest monthly closing price, noted at 1989.62 USD/oz in April 2023, serves as both a reference point and a challenge. Overcoming this level would not only signify strength but could also act as a launchpad for further price appreciation.
Conclusion
Gold’s journey in 2023 has been marked by resilience and the formation of a triple top challenge. To unlock its full potential, gold must break through the highest monthly closing price of 1989.62 USD/oz. Such a breakthrough would be a powerful signal that the pressure is building for a bullish surge, potentially pushing gold to the 2200-2500 USD/oz range. The key lies in the interplay with yields and the broader economic landscape. As gold continues its evolution, it’s clear that the highest monthly closing price is a pivotal indicator to watch.
Did you check our gold & silver premium service? In it, we cover leading indicator analysis to understand the future direction of gold and silver prices. Premium Gold & Silver Price Analysis >>


