The price of Bitcoin (BTC) is struggling. BTC is now well below its 200 day moving average, pointing lower short term. As said, short term weakness will drive long term strength, believe it or not. More importantly, BTC is fast approaching 2 critical Fibonacci levels. What does this mean?
RELATED – Bitcoin (BTC) Price Dropping – Are Concerns of Another Crypto Crash Justified?
Will BTC resolve higher, lower, or both?
Our conclusion at this point in time is that BTC will need to move lower in the short term after which it can continue its rise longer term.
We explained this in great detail in our BTC price prediction 2025.
From chart analyst Peter Brandt:
This is called an inverted expanding triangle or a megaphone. A test of the lower boundary would be to 46,000 or so. A massive thrust into new ATHs is required to get this bull market back on track $BTC Selling is stronger than buying in this pattern.
Let’s review the data and charts – we derive a similar conclusion.
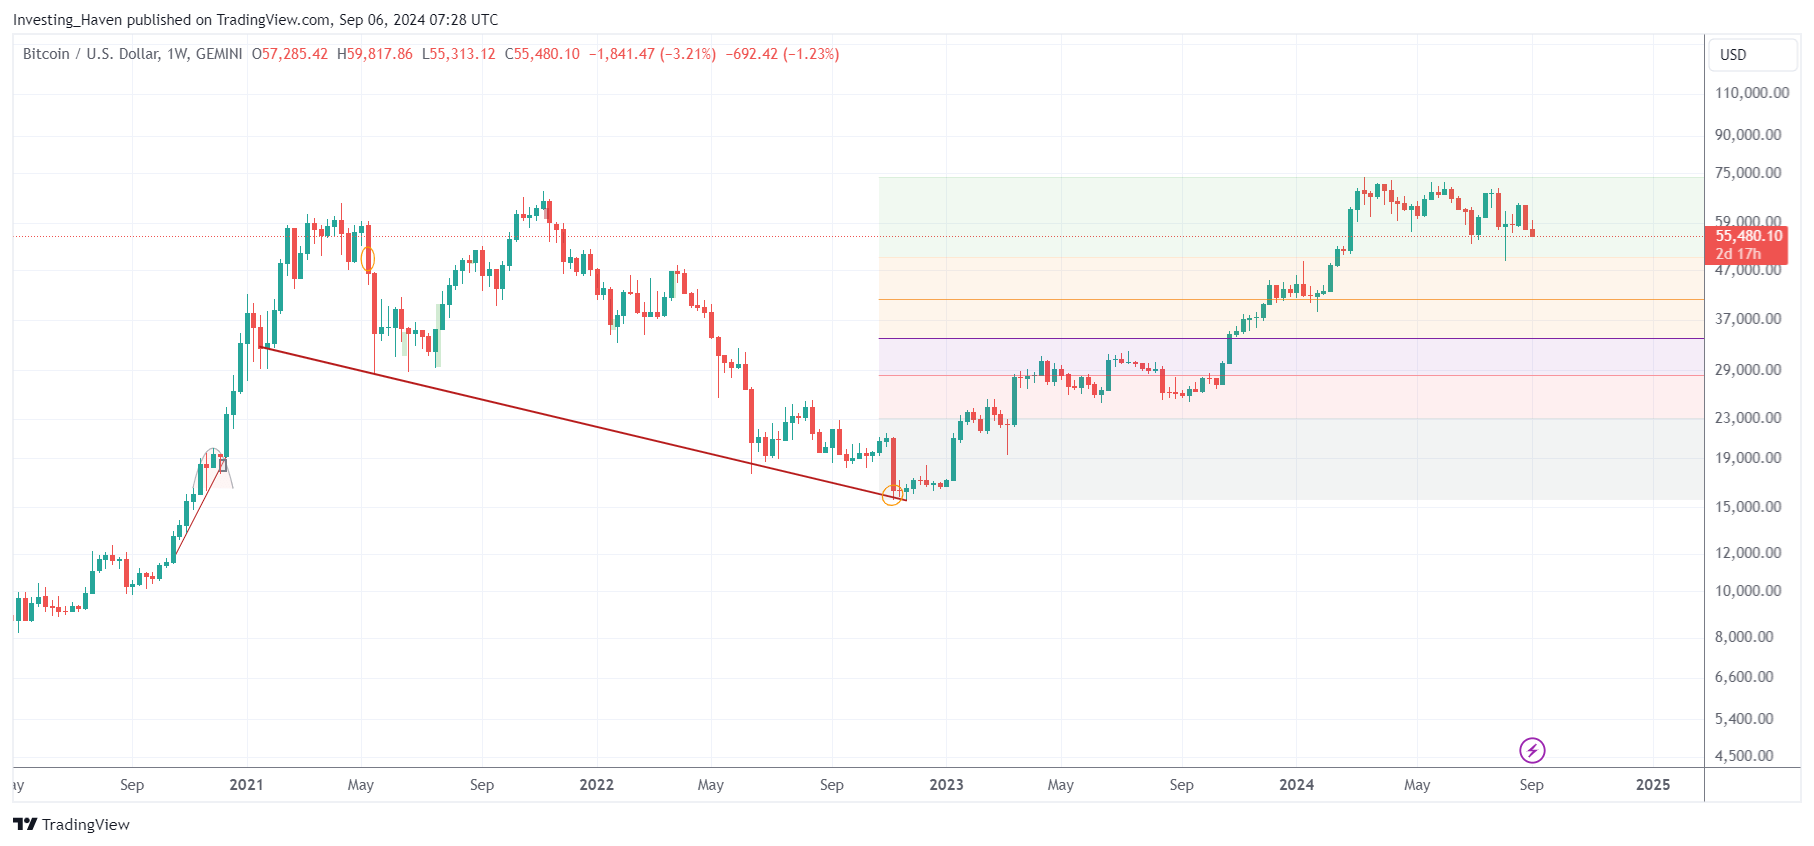
BTC price – the moving average
A few days ago, we discussed the 200 day moving average on the BTC chart.
The take-aways:
- The importance of $51k.
- The probability of $51k to be hit again.
- Why $51k is such a bullish BTC price drop level.
In the remainder of this article, we look at the BTC chart in a different way, and come to similar conclusions.
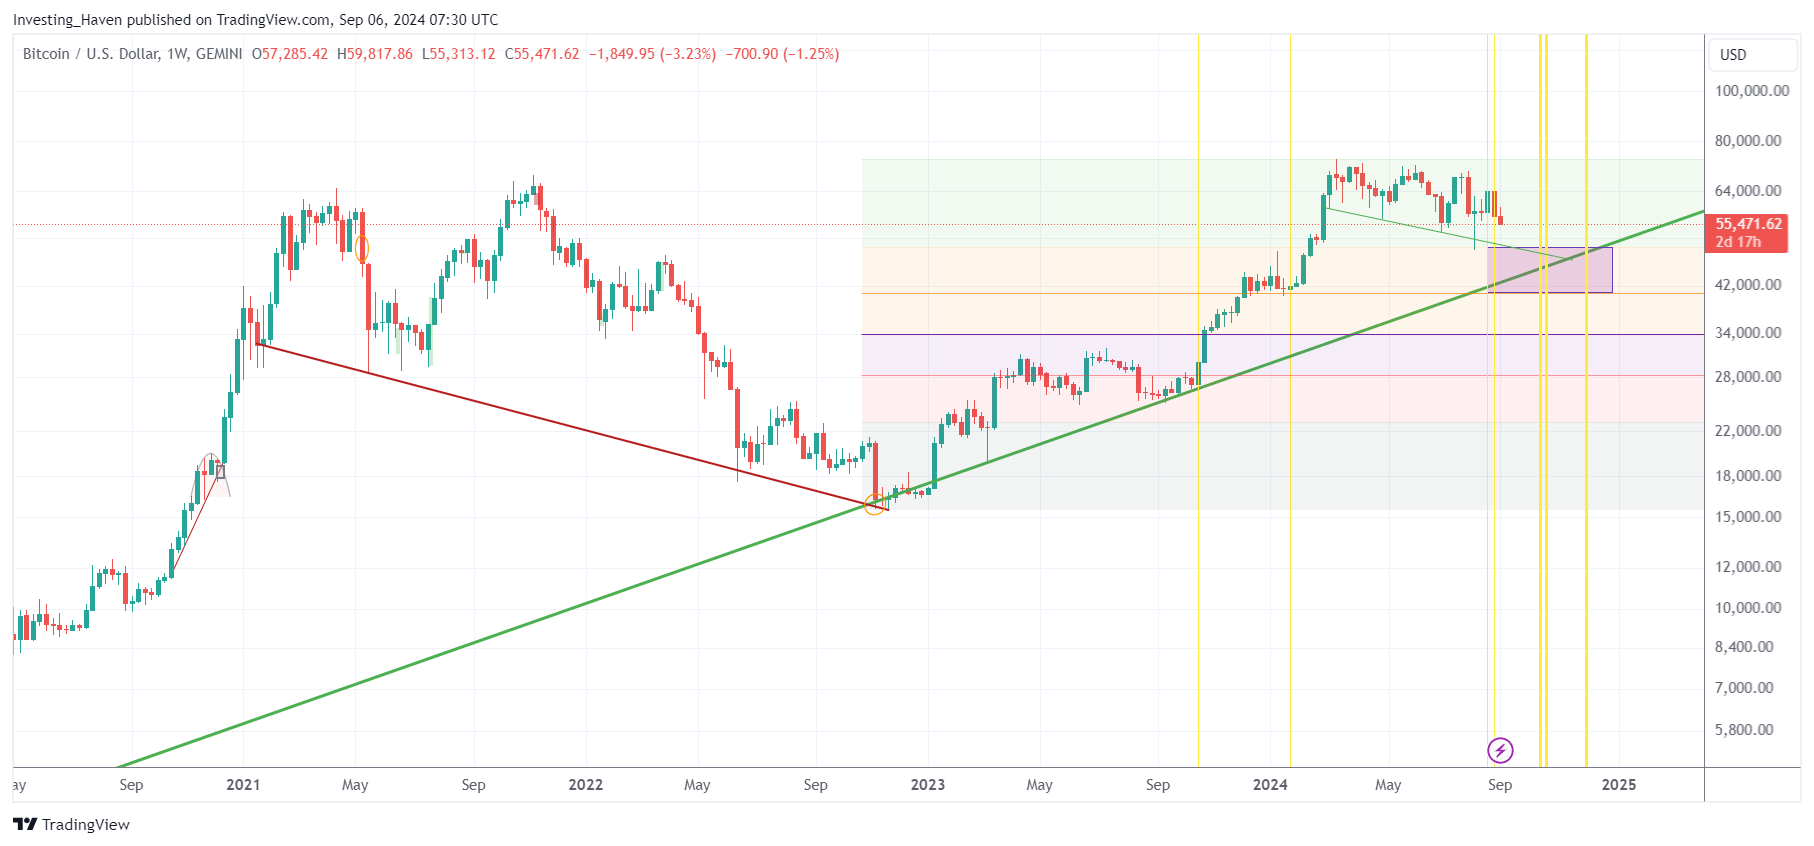
BTC price – the Fibonacci level
Bitcoin’s meteoric rise in 2023 and 2024 needs a break.
A big rise needs a big break.
That said, the most obvious pullback levels are the Fibonacci levels:
- 25% Fibonacci at $50,882 (green shaded area) – will be hit for sure – bullish level
- 61.8% Fibonacci level at $41,979 (fine yellow line) – might be hit potentially – still bullish
What we are saying is that BTC needs a break before it can create bullish energy in 2025. That’s not our message, that’s the message of the BTC chart, we just read what the chart signals.
BTC price – the trendline
Moreover, there is a confluence of chart events right in the $40k to $50k area:
- As seen below, a very long term rising trendline is going is crossing the $40k to $50k area in the period September to December 2024.
- The 2024 falling trendline is pointing to a level right below $50k.
- The area $40k to $50k is where the key Fibonacci levels are.
Moreover, there are critical and decisive points on the timeline, shown in yellow on the chart.
Our must-read post on timeline analysis – Crypto Timeline: Why October 2024 Will Be Decisive (Linkedin)
Note that the previous decisive dates which we marked on this chart (Oct 2023 and Jan 2024) was unusually accurate – a big rally started the exact same day which came out of our timeline analysis.
We believe BTC might start bouncing strongly as of mid-October 2024 – to be confirmed.
BTC to $50k
Yes, the drop to $50k was a no-brainer.
We have forecasted this since May already – our premium members got those alerts and thy are still available in the crypto research area of our site (instant access after signing up).
The only question is whether BTC will find a floor right at or right below $50k:
- If the answer is YES, which we expect, it would be very bullish for 2025 – our predicted cup and handle chart pattern will materialize – very bullish outcome.
- If the answer is NO, BTC might need to drop to the $33k – $37k area – we don’t expect this to happen, it’s the lowest probability outcome.
Whatever happens to BTC will be crucial for the rest of the crypto universe.
We remain firmly bullish long term, but are firmly convinced that short term weakness is the pre-requisite for a long term bullish outcome.
Follow our premium crypto research analysis >>

