Bitcoin Cash rallied by more than 45% today after the Commerce secretary hinted at a possible easement of Trump Trade tariffs on US neighbours.
Bitcoin Cash reacted positively to the news, and its technical indicators hint at further upside if the market sustains the bullish momentum.
After a sharp decline, which saw it lose close to 20% of its value yesterday, Bitcoin Cash (BCH) has emerged as the best-performing digital currency among the top 20 cryptocurrencies today.
Over the last 24 hours, the price of BCH surged by more than 45%, climbing from yesterday’s lows of $272 to an intraday high of $394.
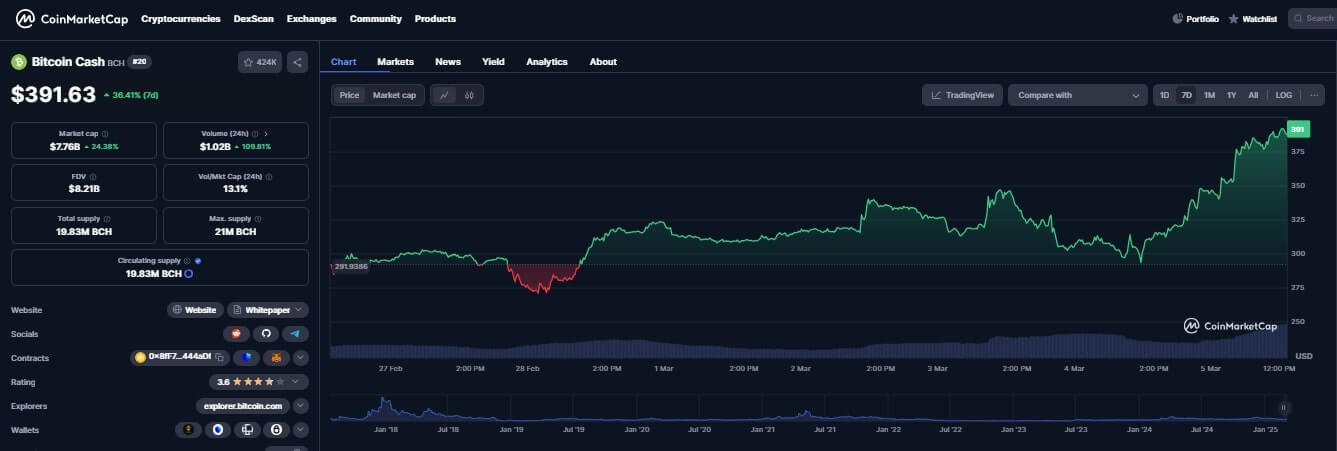
The impressive rally has been accompanied by a significant increase in trading activity, with Bitcoin Cash’s daily trading volume surging by 101% to surpass $1 billion.
Why is Bitcoin Cash Rallying Today?
Two primary reasons may be attributed to BCH’s surprising rebound.
The most impactful was the broader rebound in the cryptocurrency market, which reacted positively to news that President Donald Trump may ease trade tariffs imposed on Canada and Mexico.
The announcement, made by U.S. Commerce Secretary Howard Lutnick, has sparked optimism across financial markets and helped the crypto industry add 5%, or more than $150 Billion to its market cap, as investors anticipate eased inflation and improved trade relations between the three neighbouring countries.

Bitcoin Cash’s price surge is further fuelled by a technical breakout from a falling wedge pattern, a chart formation often signalling a trend reversal.
This bullish move has propelled BCH above its 50-day moving average (50MA), a key indicator that traders interpret as a positive sign for further gains.
If this momentum continues, BCH could set its sights on its next major resistance level at the 200-day moving average (200MA), potentially leading to even more significant price appreciation.
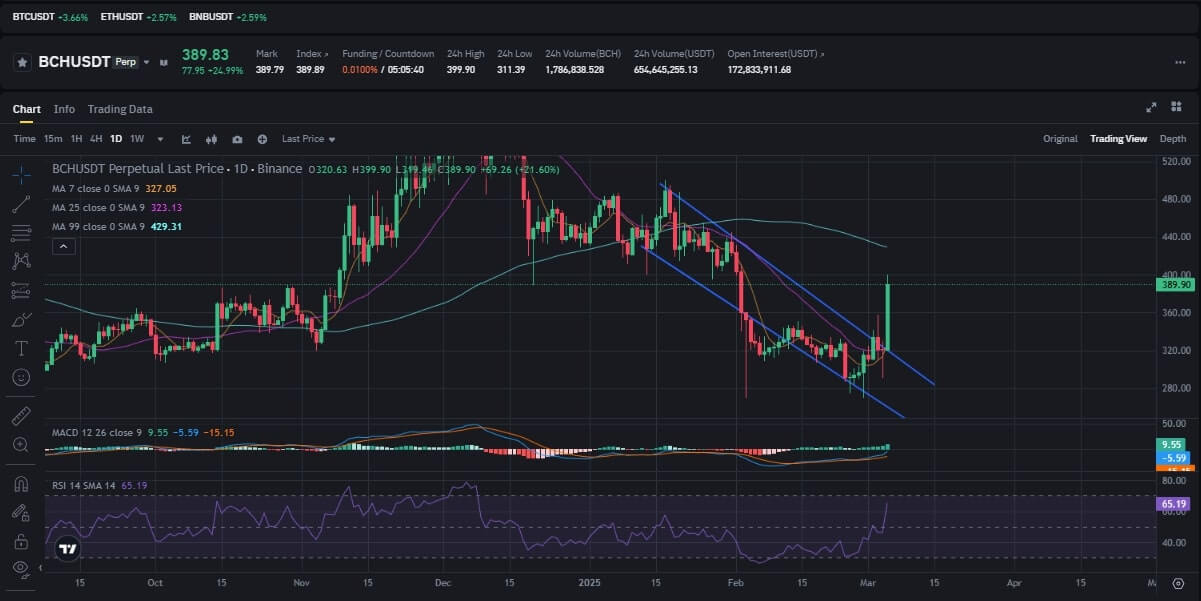
Several other technical indicators are also supporting a continued rally for BCH – at least in the short term. Its RSI has, for example, rallied from last week’s neutral levels of around 40 to more than 64 at the time of writing.
The MACD line has also confirmed a bullish reversal with the MACD line crossing the signal line from below and edging ever close to escaping the negative territory.
![]()
🚀 Don’t Miss the Next Big Crypto Move!
Our premium members received real-time alerts on major crypto plays before they happened. Will you be ready for the next one?
🔴 Latest Insider Alerts:
- 📢Buy The Dip Is Here (Feb 28th)
- 📢How To Know Whether BTC Will Set A Bottom This Week? (Feb 25th)
- 📢This Token Is Set To Emerge As An Outperformer as USD Breaks Down. (Feb 16th)
- 📢When Will This Market Finally Start Moving? (Feb 9th)
- 📢Will February 5th Come To The Rescue? (Feb 4th)
⏳ Limited Spots Available – Secure Yours Now!

