Once BTC clears $69k, on a 3 to 5 day closing basis, it will mark an epic breakout. This highest probability outcome is that this will happen in a few months from now.
Insights from this article are based on our most recent Bitcoin price prediction, available in the public domain.
TIP – We recommend readers to read out Bitcoin prediction page, mentioned above, as it contains lots of insights about Bitcoin’s expected trend as well as support and buy the dip levels.
Bitcoin price insight #1. The longest term trendline
While we are interested in short term Bitcoin price insights, for August 2024 primarily, we always have to start with the higher timeframes.
When analyzing Bitcoin’s price, it is imperative to take a top down approach.
That’s because of this chart dynamic: the longer a trendline, the more dominant.
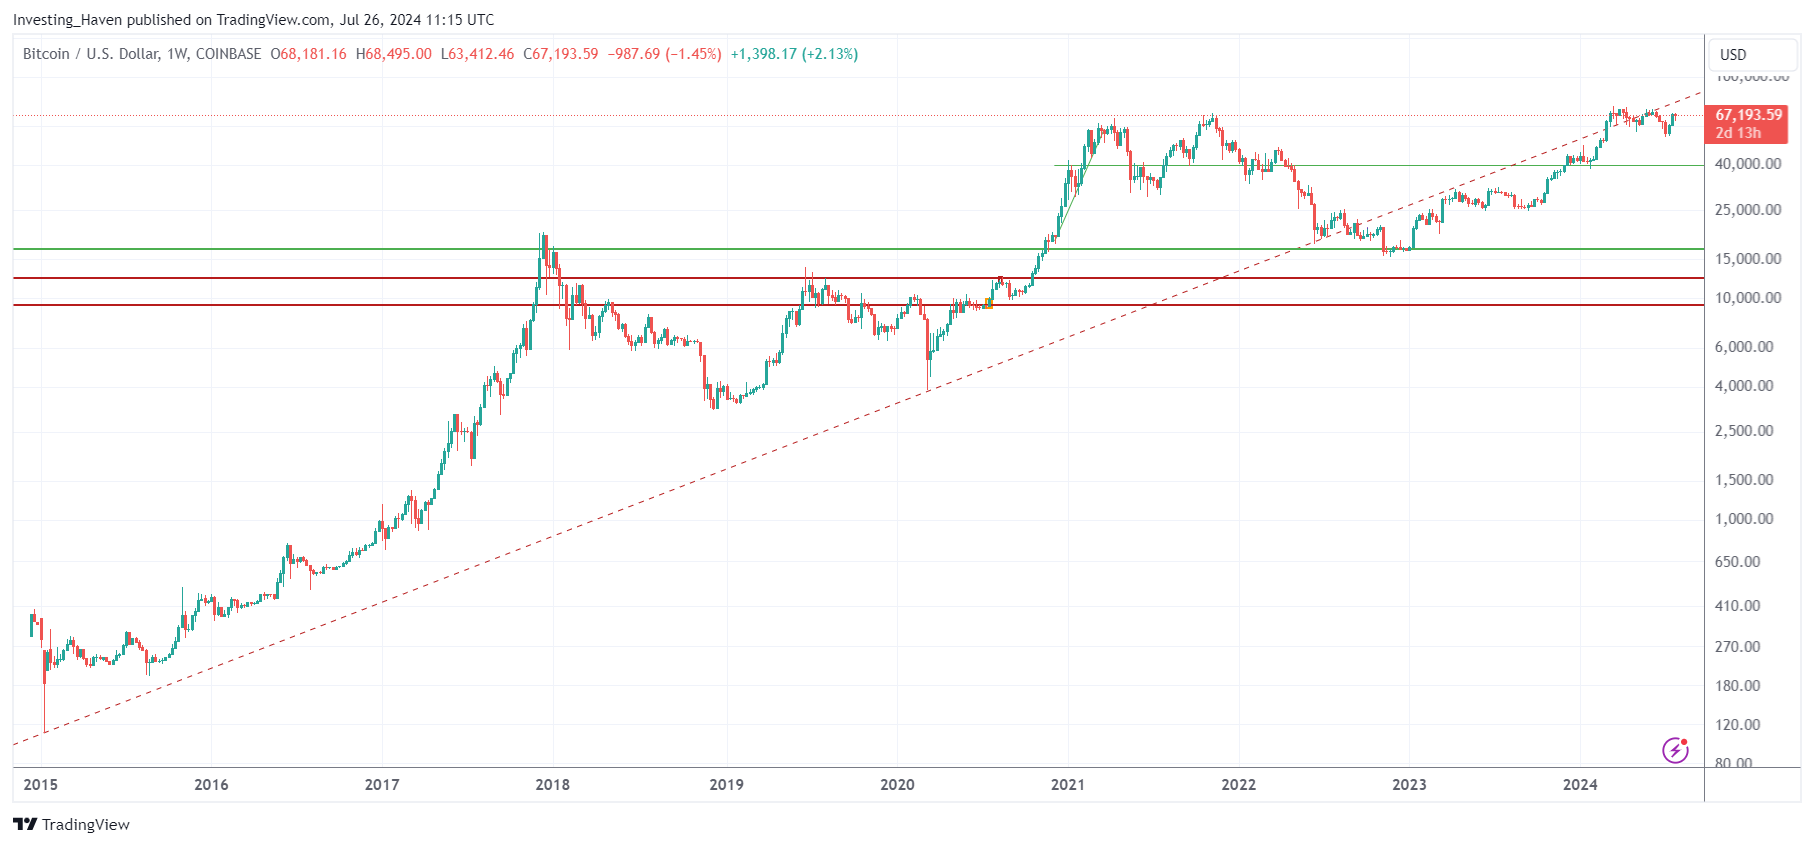
What we see on Bitcoin’s longest timeframe is that BTC fell below its longest trendline in the summer of 2022 for the first time in 9 years! In May of 2024, BTC touched this longest trendline as resistance. This is meaningful, as it might indicate that the pace of advancement (in the bigger scheme of things) is slowing down.
While this longest term trendline creates a very important dynamic on Bitcoin’s chart, it does not help us understand the short timeframe.
Bitcoin price insight #2. Another long term trendline
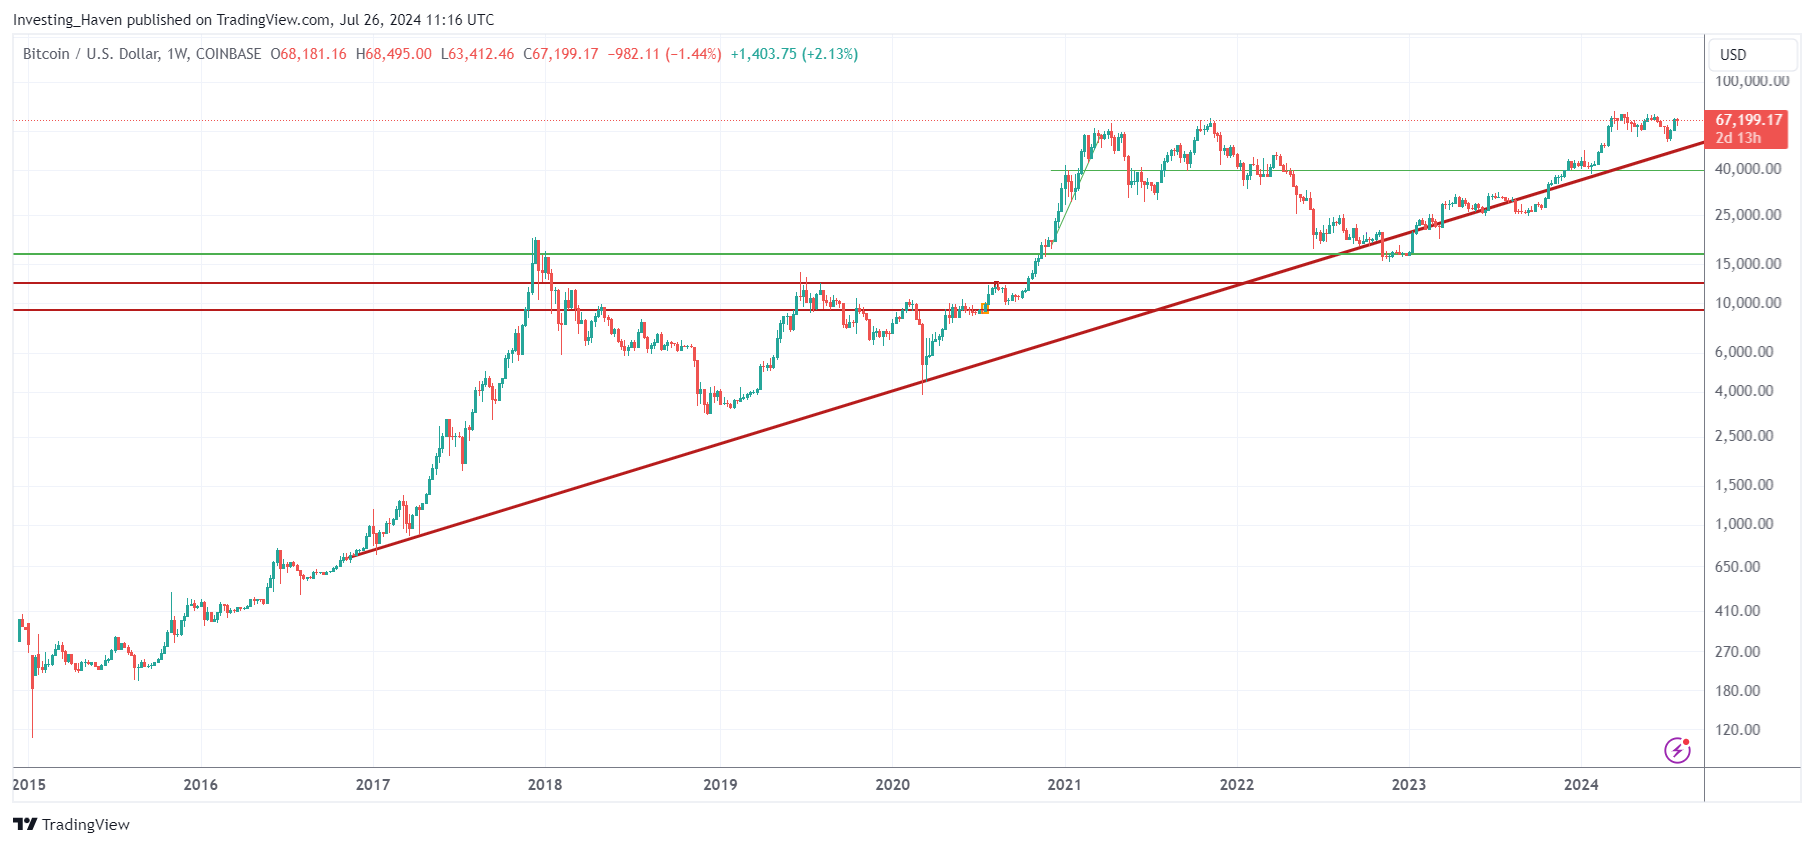
While the longest trendline since 2015 was breached some 2 years ago, the one that originates in 2017 is being respected.
This is meaningful, as it means Bitcoin remains in a strong uptrend, an insight that crypto enthusiast will like and which contrast with the somehow concerning conclusion from the chart shown above.
Short term, it means that this trendline might be tested again, in case markets get under pressure which could happen in August of 2024.
Bitcoin price insight #3. Why $69k is a critical level
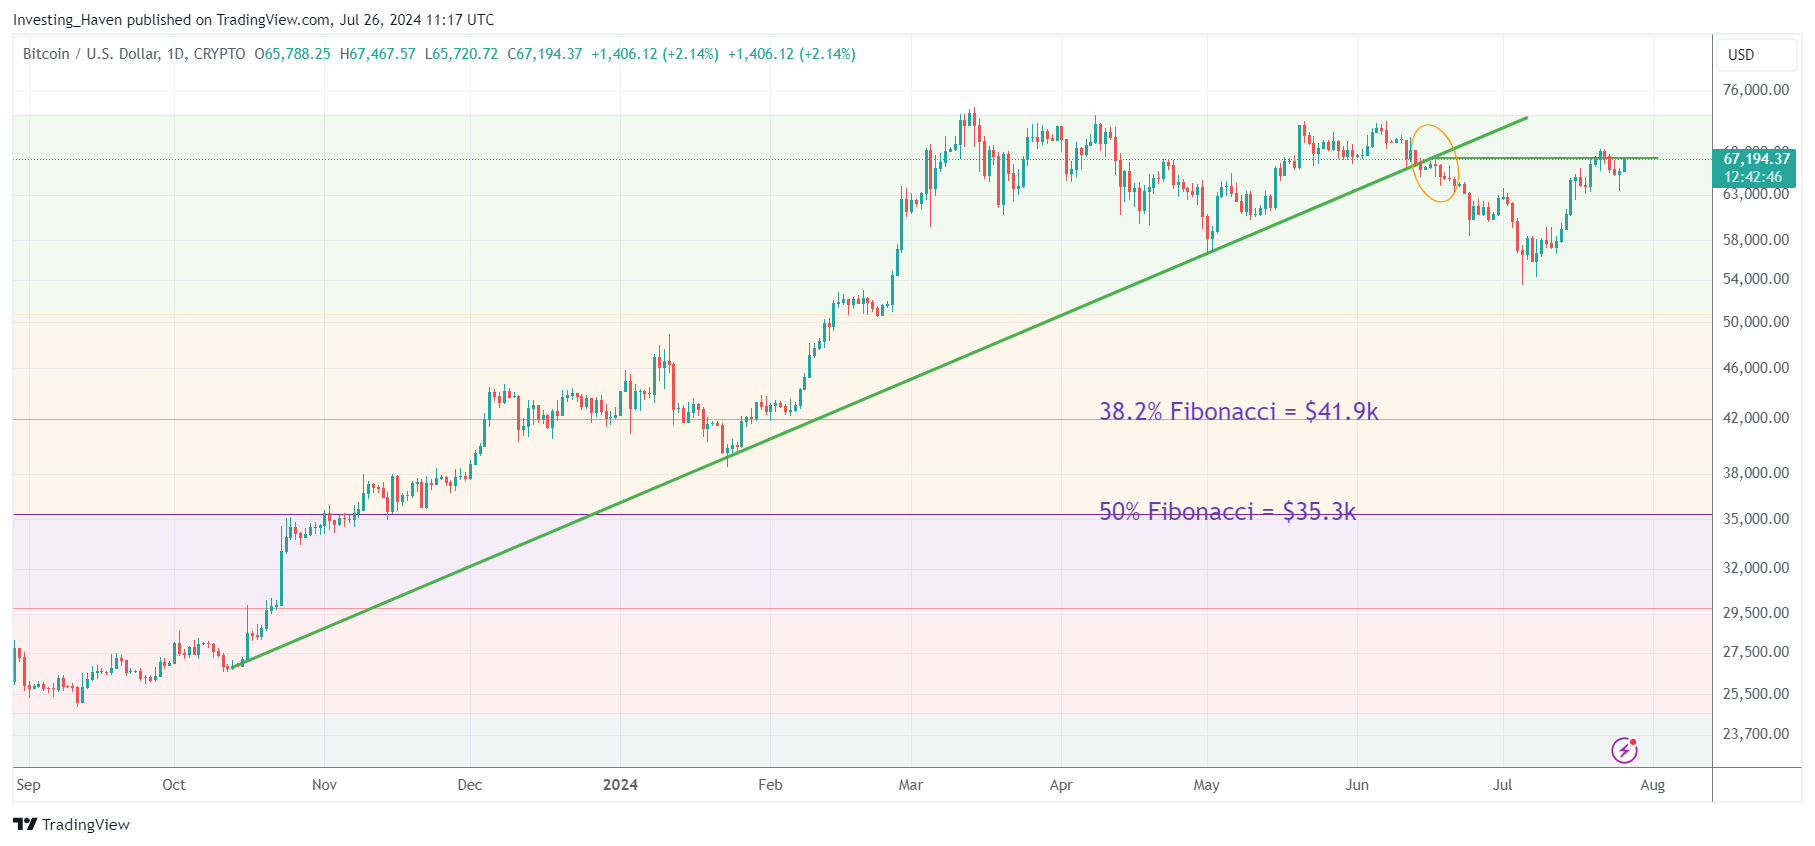
If we zoom in a bit, we see that a strong uptrend started in October of 2023, leaving a rising trendline unbroken until June 2024.
What is important to realize is the price point that marks a breakdown, in this particular case $68k roughly, can be re-tested, once or twice.
We use $69k as THE most important price point for BTC, certainly in the short term.
Remember, any price point as resistance can be exceeded for 3, 5, 8 days but price can come down, creating a failed breakout. So, if BTC moves above $69k, and stays there for at least 8 consecutive days, it will be a breakout.
It’s unlikely this will happen in August 2024. Never say ‘never’ though in financial markets.
Bitcoin price insight #4. Which ‘event’ can create another dump?
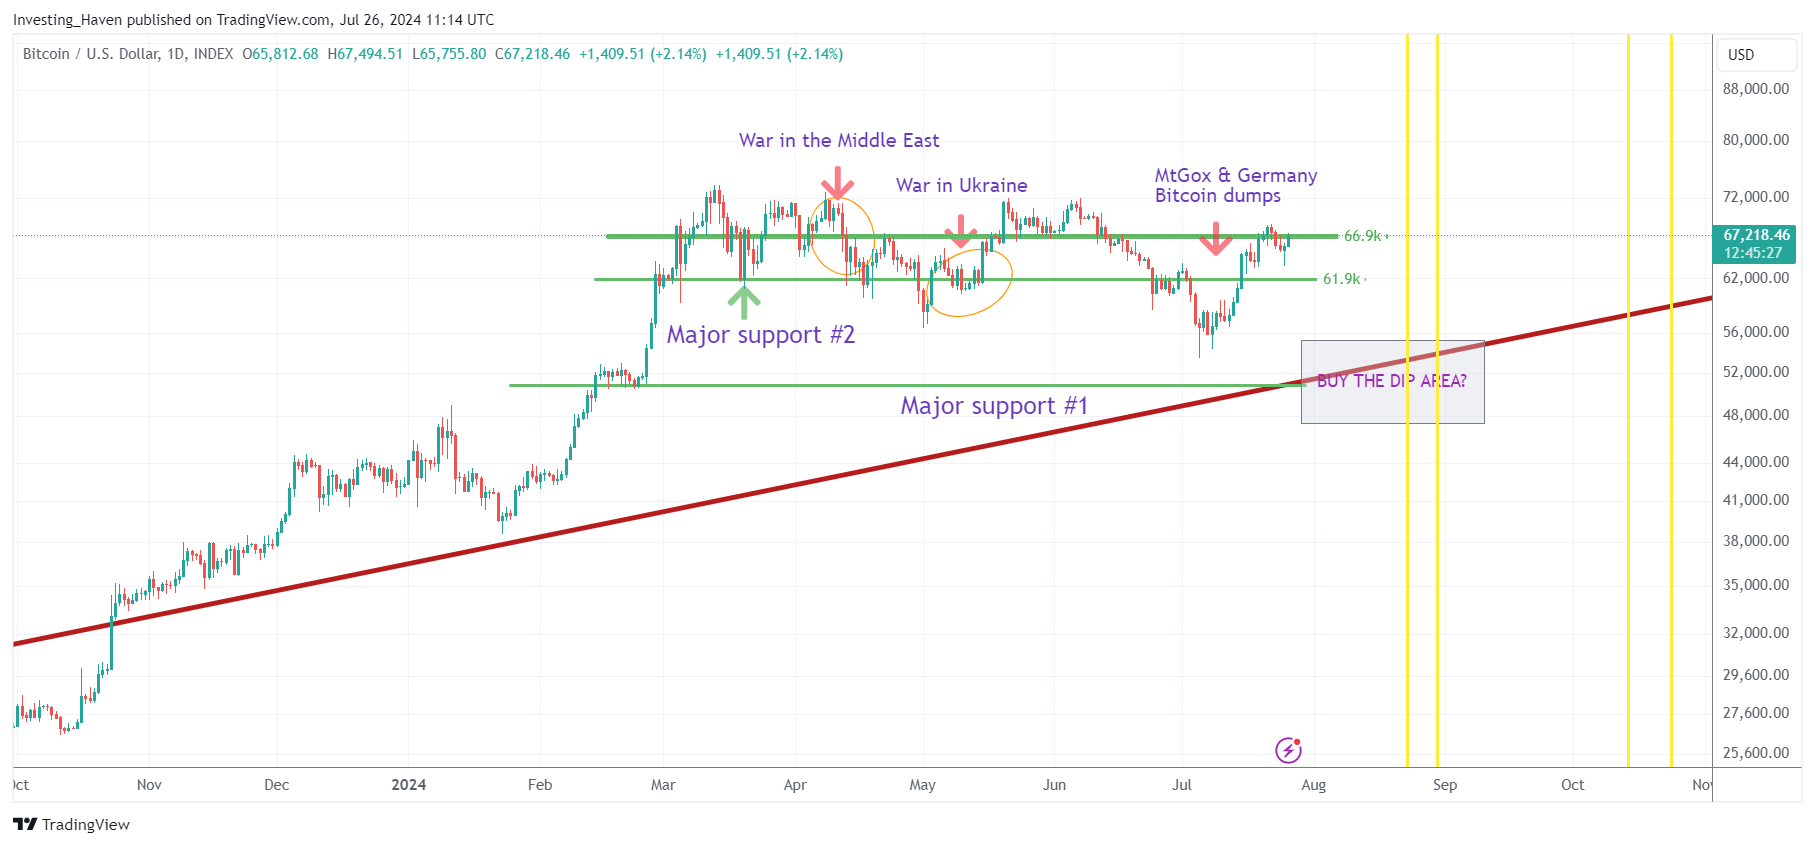
Since April, Bitcoin has experienced several dumps:
- April – war in the Middle East (fading soon after).
- May – war in Ukraine (fading soon after).
- July – Bitcoin dumped in the market by Germany and MtGox.
What might create another dump in the price of Bitcoin, in August, is broad market weakness. This is likely because there is a high probability volatility window on the timeline. We will know by mid-August whether the timeline will create volatility in markets.
Bitcoin price insight #5. Three month cycles
In closing, the last relevant insight for August 2024 comes from Bitcoin’s 3-month cycle chart.
What stands out on this chart is this:
- A falling trendline since March, tested 3 times, potentially to be tested once more in August or September, around $52k.
- Resistance at $69k.
- One critical week in August 2024.
Note – there is one more critical week in, in October.
So, we cannot get too bullish in the short term until and unless $69k is broken to the upside for at least 8 consecutive days. That’s what this 3-month cycle chart learns us.
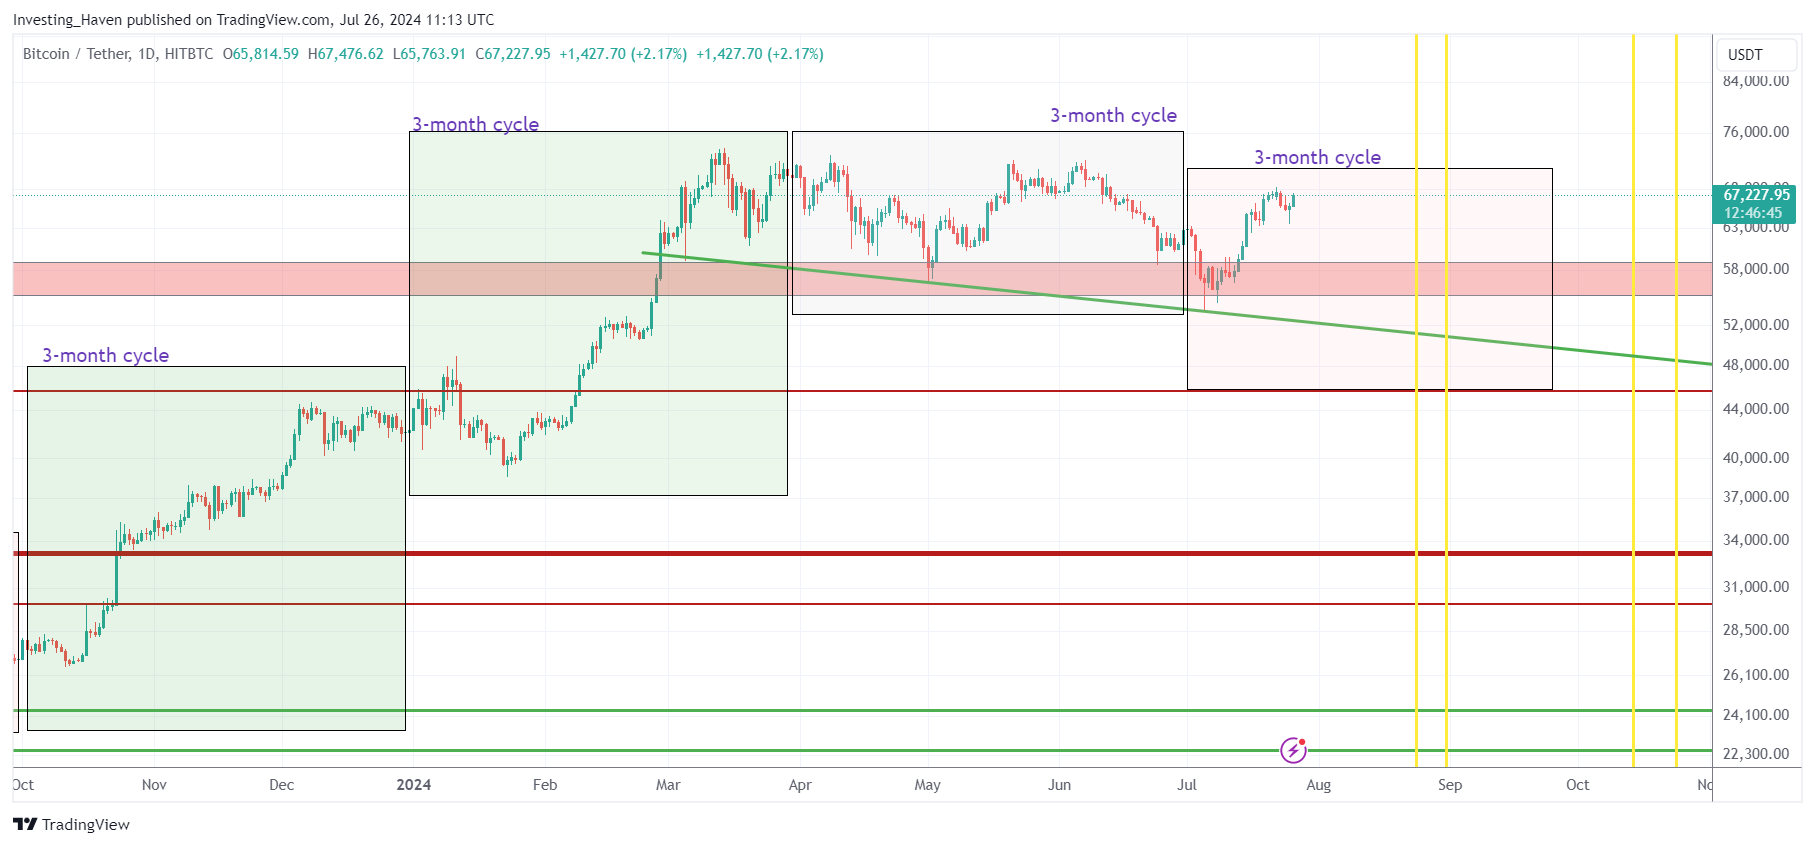
The yellow vertical lines on the last chart are critical timeline insights.
In particular, our research revealed two specific weeks in the coming 3 months that will give us decisive information about the state and future of crypto markets.
Want to find out the exact dates and weeks? Our research insights are available in this article (sign up required) in the restricted area of our website: Where and When Could Bitcoin Bottom: Price & Timing Targets

