Bitcoin dropped from $20,800 to $17,600 in a matter of hours last weekend, . A good reminder how incredibly volatile this sector is. High risk, high reward if you manage risk and choose your entries wisely.
Today’s article will cover Bitcoin’s Price action following what most media would refer to as a Price Crash in Crypto. In our case, we prefer to refer to it as a pull back. It did take investors on a crazy ride as mentioned in our Bitcoin price weekend update . 24 hours later, the price came back above $20,000.
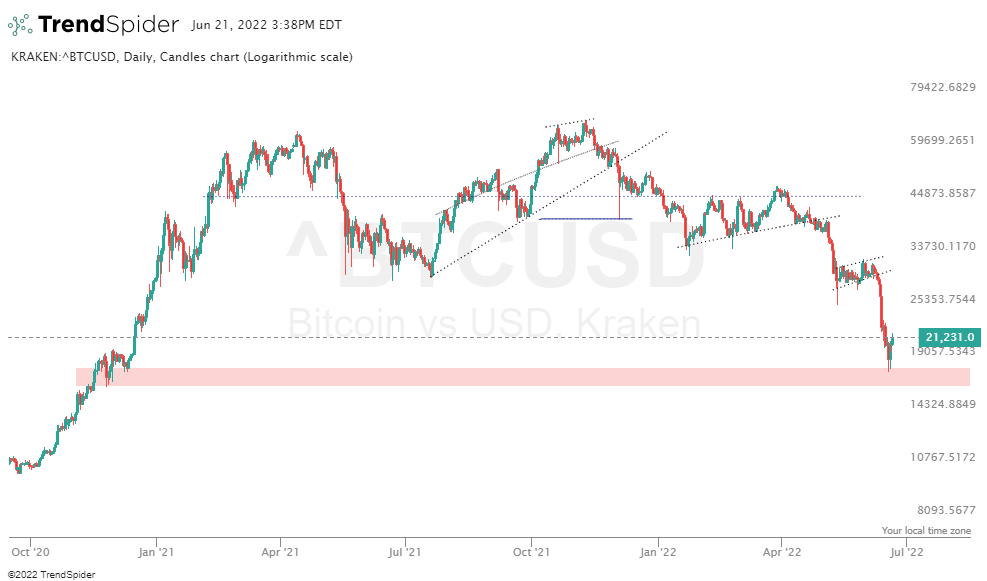
In the same article, we shared the Daily chart to understand where the price is standing as well as the beautiful long term uptrend in Bitcoin’s price. So how is the price performing so far against the price levels mentioned earlier? What does the long term structure look like after this pull back? Those are the questions we will try to cover based on charts.
Bitcoin Price On the Daily Chart
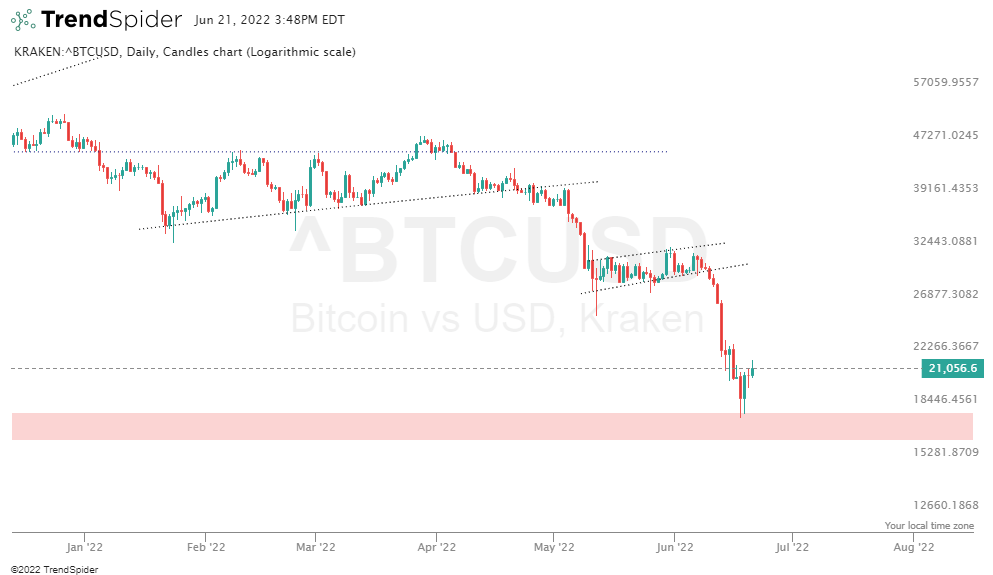
The price bounced right at the annotated pink trendline. In other words, it did exactly what it was supposed to do and bounced exactly where is was supposed to bounce. Which is extremely constructive for Bitcoin’s long term uptrend and price structure.
During the next few weeks, our Blockchain premium team will focus on the key levels investors should focus on. To do so properly and tune out the noise, our methodology is focused on 2 folds:
- Our 1/99 investing principles : An approach that focuses on the 1% of actions that has the highest impact on an investor’s bottom line and success in investing.
- Price analysis, an analysis that covers both Price action patterns and Time axis patterns. This is not covered in this article but is something we are starting to incorporate in the price analysis for both the momentum and Crypto premium services. It is simply fascinating how patterns are not limited to price but can span across different variables such as time.
As you can see above, we have a perfect bounce of support, the price quickly reclaimed that $20,000 level. This could be shaping up to become a V-shaped recovery just like it could become a consolidation channel before another leg up. It’s too early to tell but we will be watching and updating accordingly.
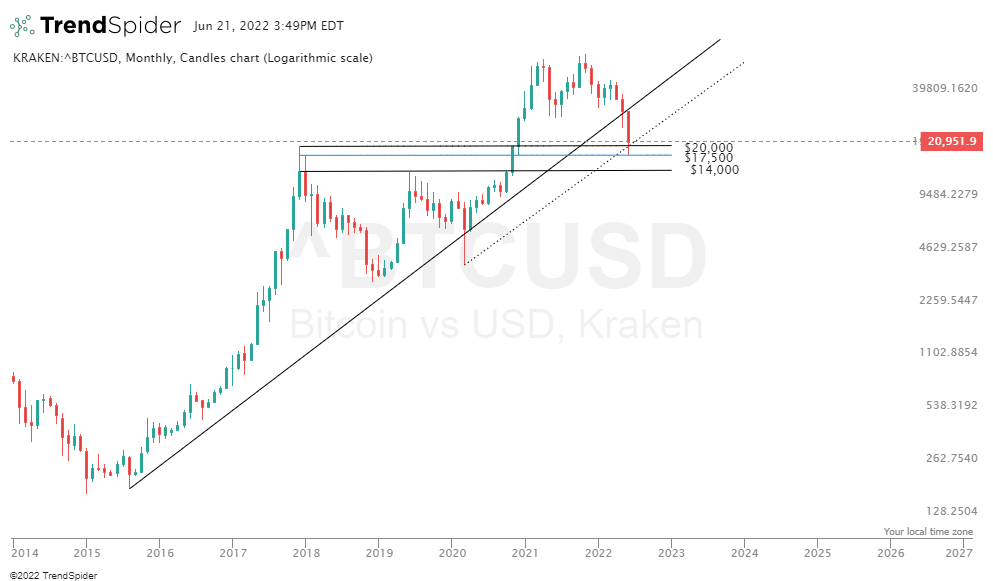
Bitcoin Price On The Monthly Chart
The monthly chart shows the uptrend is still intact. It also shows how the price is recovering and trying to push higher. Obviously nothing goes up in a straight line and pullbacks should be expected. Even if this ends up becoming a V-shaped recovery, there will still be resistances along the way.
Written by hdcharting.


