Bitcoin price seasonality chart analysis suggests recurring patterns since 10 years. In this post, you’ll find easy Bitcoin seasonality charts, with clear take-aways.
RELATED – Bitcoin price prediction 2025
With $BTC being notorious for its ups and downs, knowing when the market typically shines (or slumps) could give you a serious edge.
From price surges to potential dips, Bitcoin’s seasonal trends are more predictable than you might think. Here’s what we’ve discovered based on Bitcoin price seasonality analysis.
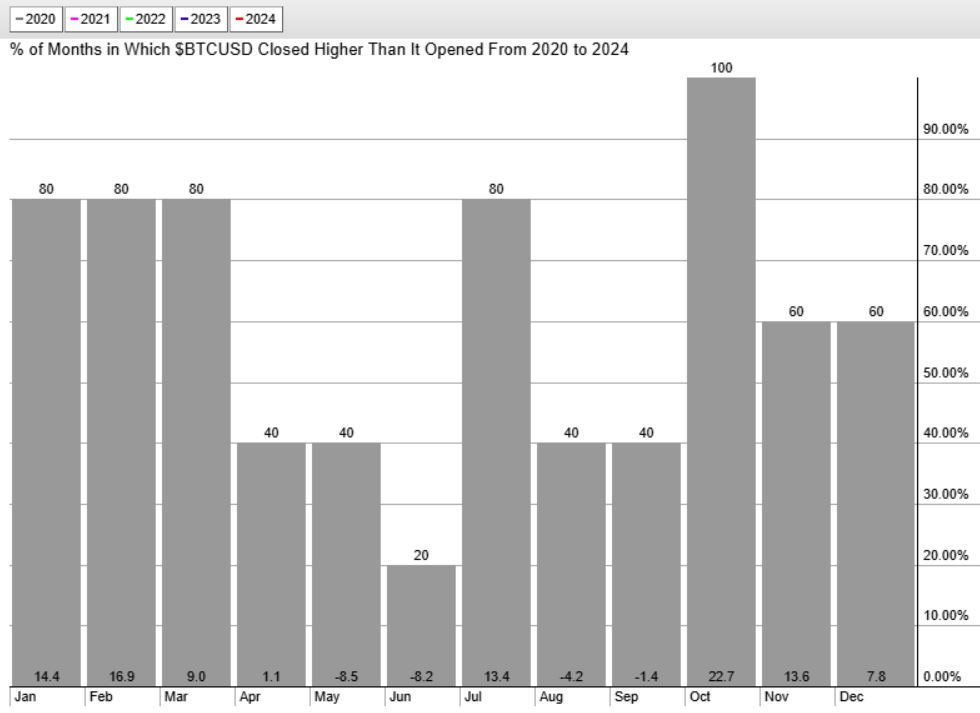
Bitcoin Price Seasonality 2020-2024 — Recent Trends
What happened to BTC in the last 5 years?
Take a look at what history says about the most recent price moves from 2020 to 2024.
📈 Big Wins:
- February, April, October: These months are BTC’s golden trio, where price gains happened more frequently. Could be a smart time to position yourself.
📉 Tough Times:
- June and September: Dips and volatility were common in these months. Best to tread lightly during this time.
🎄 Year-End Magic:
- December: BTC tends to finish strong, with a year-end rally in sight. Could be a great time to ride the bullish wave before the holidays.
December 19th – Since 2020, there has been one consistently winning month which is October. Equally interesting is consistently strong behavior in the period January till March. This suggests that a ‘buy the dip’ opportunity may be underway.

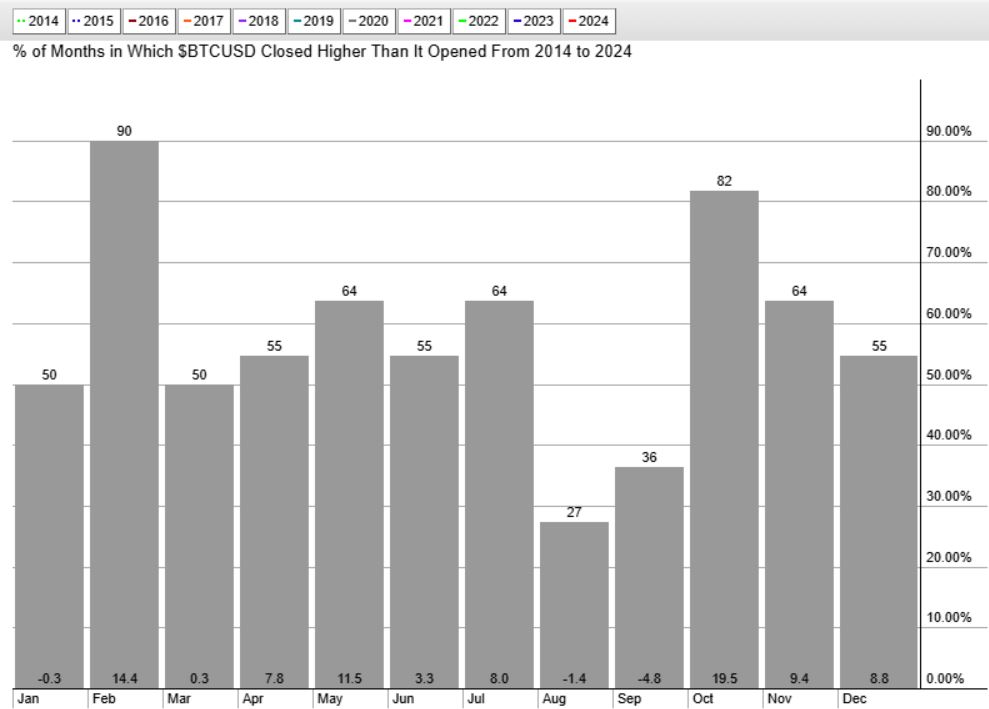
Bitcoin Price Seasonality — Longer-Term Perspective
Look back to 2014 to see how Bitcoin behaved. Here’s what’s consistent:
🔥 February and October:
- Whether you’re looking at the last 5 years or zooming out to 2014, February and October are consistently strong. These are months where BTC has historically surged, so mark your calendar!
⚠️ August:
- Recurring dips in August. If you’re thinking of entering the market, these might be the better month to watch from the sidelines or consider a different strategy.
🌀 Mid-Year Volatility:
- The summer months (August and September) bring unpredictable swings, making it harder to forecast price moves. While some years are good, others can be rocky.
🎉 Year-end rally:
- October through December isn’t just about holiday cheer. It’s also the month where BTC tends to rally hard, setting the stage for a year-end surge.
December 19th – When looking at the data set since 2014, the biggest winner of the year for BTC has proven to be February. It is the highest probability winning month. Essentially, in only one out of 10 years did February not close higher than where it started.

The Key Takeaways: What’s Next for Bitcoin in 2025?
Ready to make some smart moves in 2025? Based on past trends, here’s what to keep in mind:
Best months for gains:
Keep your eyes on February for potential big moves. Buy the dip in December and January?
Watch out for August:
The historically weakest month seems to be August, these are periods of increased risk. Volatility is king here.
Mid-year hot summer:
The month of July tends to be hot for BTC.
Year-end boom:
Position accordingly during seasonally weak months August & September because October tends to be great while a year-end rally is very often a reasonably high probability outcome (with peaks in the period Oct through Dec).
Bonus tip
If you’re diving into Bitcoin for the first time or are a seasoned trader, keeping an eye on seasonality trends can help you avoid the rollercoaster and optimize your positions. Now that you know the months to watch, the next move is yours. Are you ready?


