
Bitcoin sits near six figures, with a large options expiry and uneven ETF flows likely deciding this week’s direction.
Bitcoin trades around $112,000 after a mid August peak above $124,000 and a month end pullback of about 6%. Market participants now watch an outsized options expiry this week and recent ETF flow reversals for signs of renewed buying or renewed selling pressure.
BTC recently broke resistance at $110,000.
To understand how the price will move this week, let’s look at the current technical snapshot and Bitcoin price prediction.
RELATED: Bitcoin Price Prediction: MEXC Executive Forecasts Rally to $130K
Technical Picture And Derivatives Catalyst
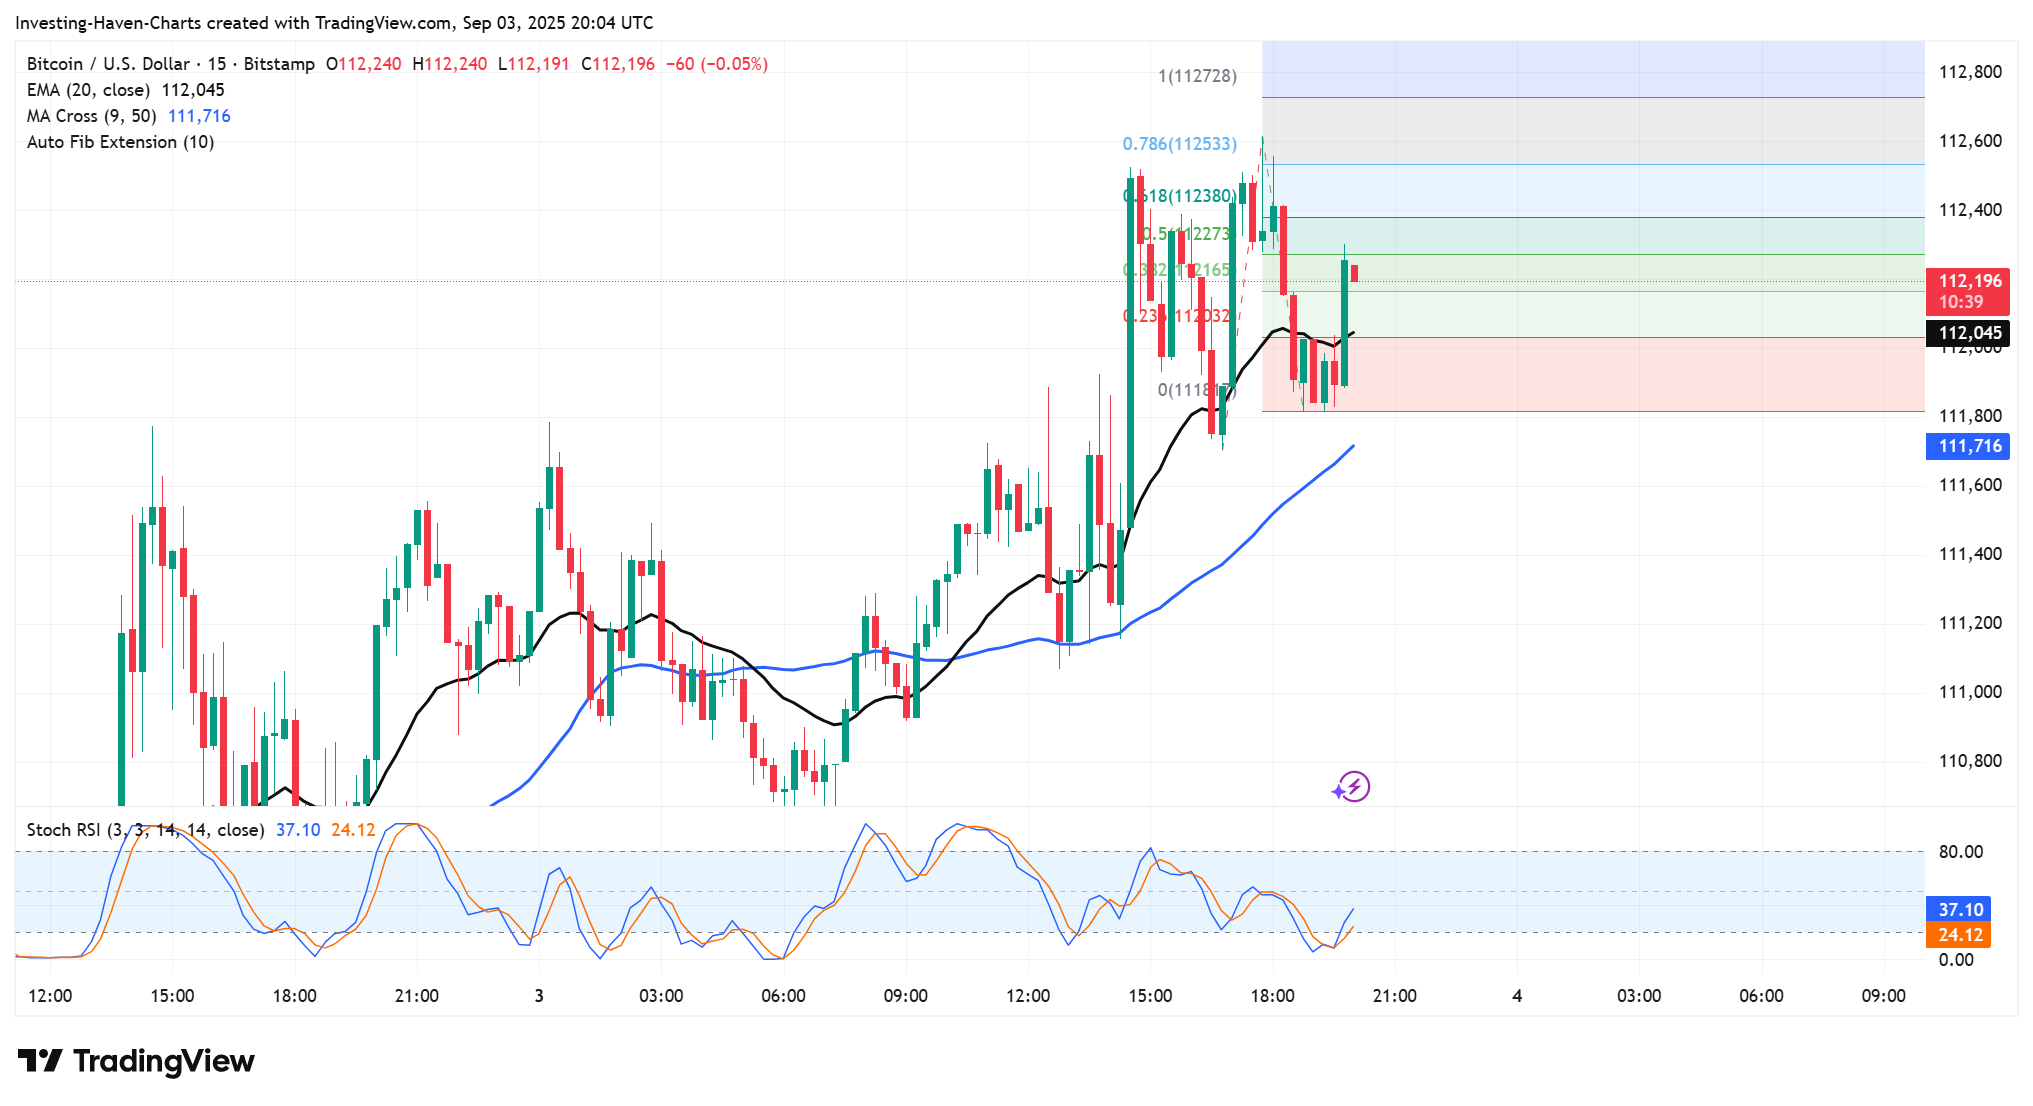
Immediate BTC technical resistance sits around $112,500 band where open interest concentrates. Market reporting shows roughly $11.6B of BTC options notional within a larger $14.6B combined BTC and ETH expiry, and the put to call ratio sits near 0.79.
That sets a max pain zone around $116,000 with heavy put strikes between $110,000 and $115,000. When many contracts cluster at those strikes, price often meets reactive liquidity that can absorb buying and stall a breakout.
Traders will watch expiry prints and open interest by strike for near term guidance.
RECOMMENDED: Why Bitcoin Is Down And Whether It’s A Smart Buy
Institutional Flows And Market Structure
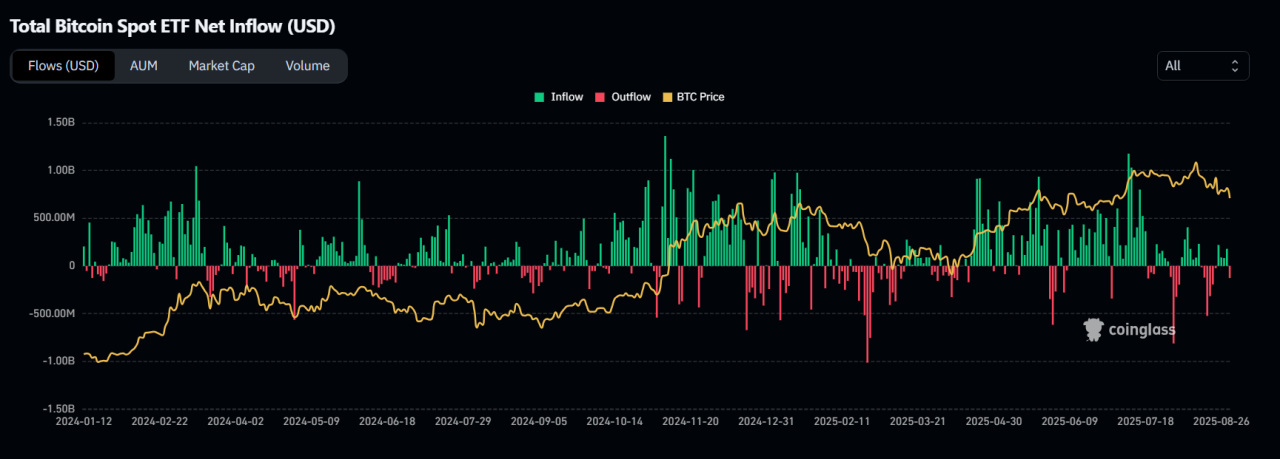
Bitcoin institutional flows look mixed, removing a clear tailwind for bulls. Data show about $751M of net outflows from U.S. Bitcoin spot ETFs in August while a recent weekly print recorded roughly $126.7M of redemptions, trimming AUM around $140B.
At the same time Ether products attracted strong inflows, shifting some institutional attention toward ETH. With ETF flows uneven and U.S. markets thin for the Labor Day holiday, a lack of fresh buying could leave BTC vulnerable if sellers press the options cluster.
Monitor daily ETF prints and AUM changes for immediate confirmation.
RELATED: Bitcoin $200K in 2025? Scaramucci Reaffirms Bold Price Forecast
Macro, Seasonality And Short Term Odds
September has historically leaned weak for Bitcoin, closing red in 8 of the past 12 Septembers with an average negative return in some samples.
Macro headlines and Fed guidance can flip that pattern quickly, but seasonal weakness plus the current options concentration increase the odds of a retracement toward $100,000 unless ETF inflows re-accelerate. Look out for Fed comments and CPI releases for triggers.
Conclusion
After a strong week, Bitcoin’s momentum leans toward a breakout above $112,500, with only a brief retest toward $100,000 as a secondary scenario. Options expiry prints and daily ETF net flows will likely serve as the key tiebreakers, with volume and on-chain activity offering final confirmation.
Don’t Miss the Next Big Move – Access Alerts Instantly
Join the original blockchain-investing research service — live since 2017. Our alerts come from a proprietary 15‑indicator methodology built over 15+ years of market experience. You’re following the service that identified major turning points through crypto winters and bull runs alike
Act now and see why thousands trust us to deliver signals before markets move.
This is how we are guiding our premium members (log in required):
- BTC Testing Long Term Trendline. Here Is Short and Long Term Guidance. (Aug 26th)
- Crypto – To Break Out Or Not To Break Out? (Aug 23rd)
- What Happened This Week? Leading Indicator Analysis and 7 Token Charts. (Aug 16th)
- Crypto Shows More Resilience Than Expected. A Bullish Impulse May Be Underway. (Aug 9th)
- Prepare To Buy The Dip In Crypto (Aug 2nd)
- Alt Season 2025 – Progress Update (July 26th)

