SOL shows confirmed triangle breakout targeting $180–190, while ADA hovers in a high-stakes consolidation near key resistance.
Usually, triangle breakout setups can signal strong directional moves. Right now, Solana has already blasted beyond a symmetrical triangle, targeting $180–190, whereas Cardano is tightening inside its triangle, waiting for a decisive breakout.
Solana – Breakout Already in Motion
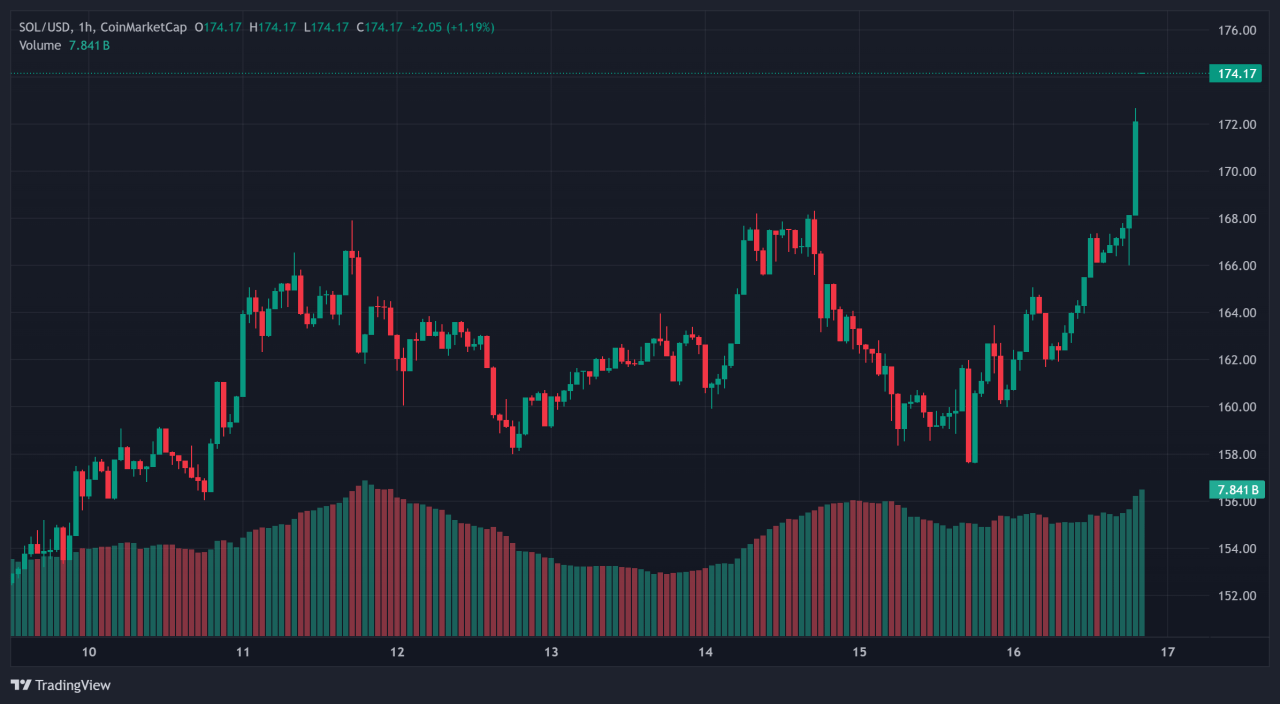
Solana recently broke above a symmetrical triangle on the 4‑hour chart, with analysts highlighting the move above $158 resistance as a bullish signal. The price is currently holding above $174 with the $170 zone now serving as support.
Today’s surge (more than 7%) is backed by on-chain strength: over 14 million active daily addresses and strong inflows around $8.3 B in recent weeks. Technical models, including Fibonacci confluence, point toward a potential rise to $180, possibly even $190–200 in the coming weeks .
With momentum indicators resetting from oversold and volume confirming the breakout, SOL’s triangle breakout appears robust and underway.
Cardano – Triangle Forming, Breakout on the Horizon
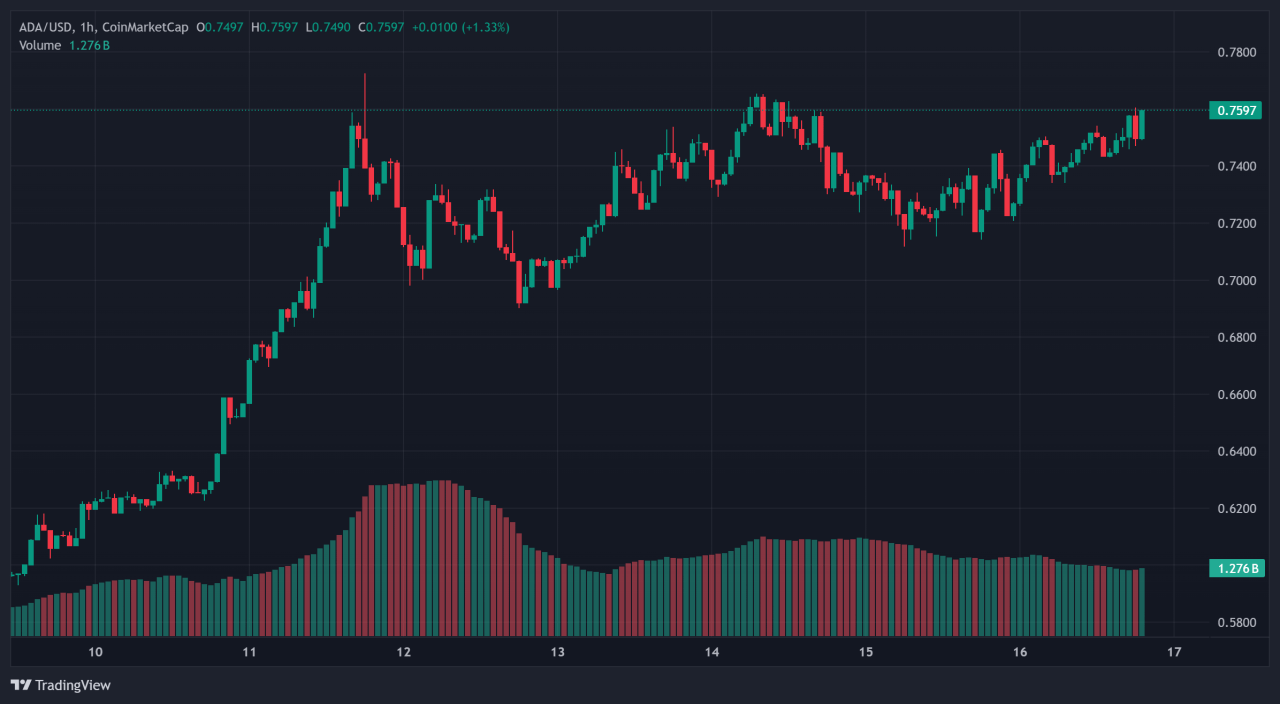
Cardano is consolidating within a symmetrical or ascending triangle between $0.59–0.76. After rallying ~39% in July, ADA trades around $0.72–0.76, close to its upper resistance.
Technical indicators – RSI around 68, MACD bullish, golden cross confirmed – signal growing momentum. Yet, ADA hasn’t broken the $0.75 mark decisively; a breakout above this could retest $1.00+, with analysts eyeing targets up to $1.25–1.50 .
Conversely, a failure here risks a drop toward $0.55–0.60 support . For now, Cardano remains in a critical “watch-and-wait” phase.
Comparing Strengths & Risks
Solana’s breakout is confirmed: triangle resistance cleared with volume, strong guidance from Fibonacci, and on-chain metrics all aligned. Momentum is clearly in its favor.
Cardano, while technically set up, needs a breakout above $0.76 to validate its triangle formation, making it more conditional. SOL’s risk lies in false breaks, but current support levels offer defined stop zones. ADA offers higher upside potential (40–100%) but comes with a greater risk of breakdown.
Conclusion
SOL leads the charge with a confirmed triangle breakout, targeting $180–190 – an optimal play for aggressive, momentum-driven traders. ADA, by contrast, remains in a setup phase; its triangle breakout would offer attractive rewards, but confirmation above resistance is essential.
For now, Solana forms the stronger triangle breakout, while Cardano remains the one to watch.
Our latest crypto alerts – instantly accessible
This is how we are guiding our premium members (log in required):
- Is Alt Season 2025 Here? (July 15th)
- Alts Breakout Happening Now. These Are Price Time Combinations To Watch. (July 11th)
- Crypto Charts Are Improving, Just Have A Look At These 3 Leading Indicators (July 6th)
- Alt Season 2025: The Animals Are Back, This May Be A Very Bullish Signal (June 29)
- BTC And Altcoins About To Hit Big Support Areas (June 22)
- The Alt Season Charts (June 15th)
- Another Test of 106.1k, Is This THE Big One? (June 8th)


