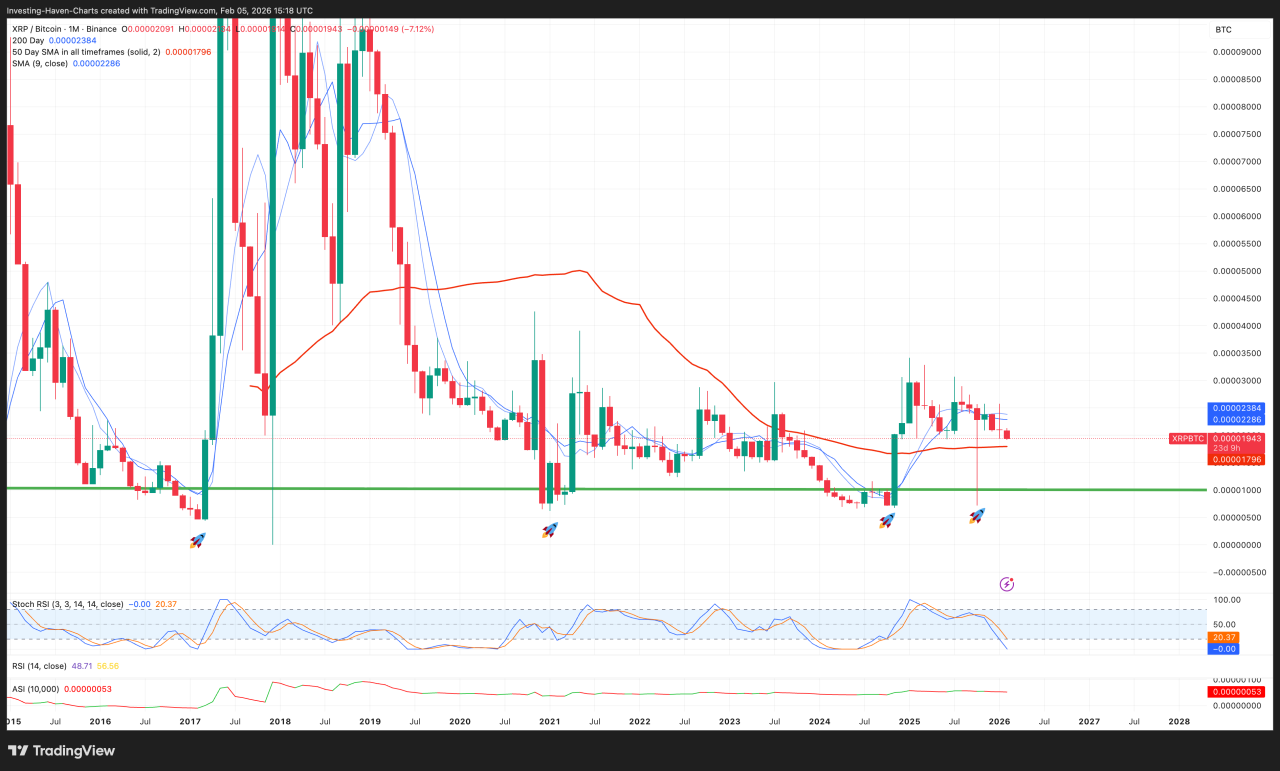
XRP/BTC shows a long-term floor around 0.00001 BTC. Shorter opportunities appear between the 50-SMA and 200-SMA, if momentum and volume confirm a reversal.
XRP/BTC trades around 0.00001943 BTC on the monthly chart, sitting between the 50-SMA at about 0.00001796 and the 200-SMA at about 0.00002384. Stoch RSI sits close to 20, which signals oversold momentum, while RSI holds around 49, which shows neutral strength.
This setup creates tension between buyers and sellers and often leads to decisive moves after periods of tight trading.
XRP has also followed broader crypto swings during recent market pullbacks, so it’s important you plan carefully before entering.
The chart now presents two main buying zones, one short term based on moving averages and one long term based on a multi-year support line.
RECOMMENDED: Where To Buy XRP In 2026 – Global Liquidity, Fees & Access
Long Term Support Level For XRP Buyers
The monthly chart shows a strong horizontal support level around 0.00001 BTC. Price revisited that area in 2016, 2020, and again after sharp drawdowns in 2024, which creates a structural floor where sellers have historically exhausted themselves and buyers stepped in.
Repeated tests build a reliable reference point because traders remember where strong reversals happened before. When price returns to this area, buyers often step in early, expecting history to repeat.
Strong lower wicks or bullish monthly closes often signal that sellers failed to push the price lower.
If price closes decisively below 0.00001 on monthly timeframes, treat that as a failed structural support and reassess position sizing. The chart itself is the main evidence for this plan, and you should check live quotes at execution.
RECOMMENDED: 5 Reasons XRP Could Double Your Money In 2026 After The Drop
Short Term Entry Signals From Moving Averages
The space between the 50-SMA and 200-SMA offers tactical trading opportunities. The 50-SMA often acts as short-term support during consolidations, and price reactions there can create quick entries for traders who prefer shorter holding periods.
A bullish candle with strong volume near the 50-SMA improves the odds of a bounce.
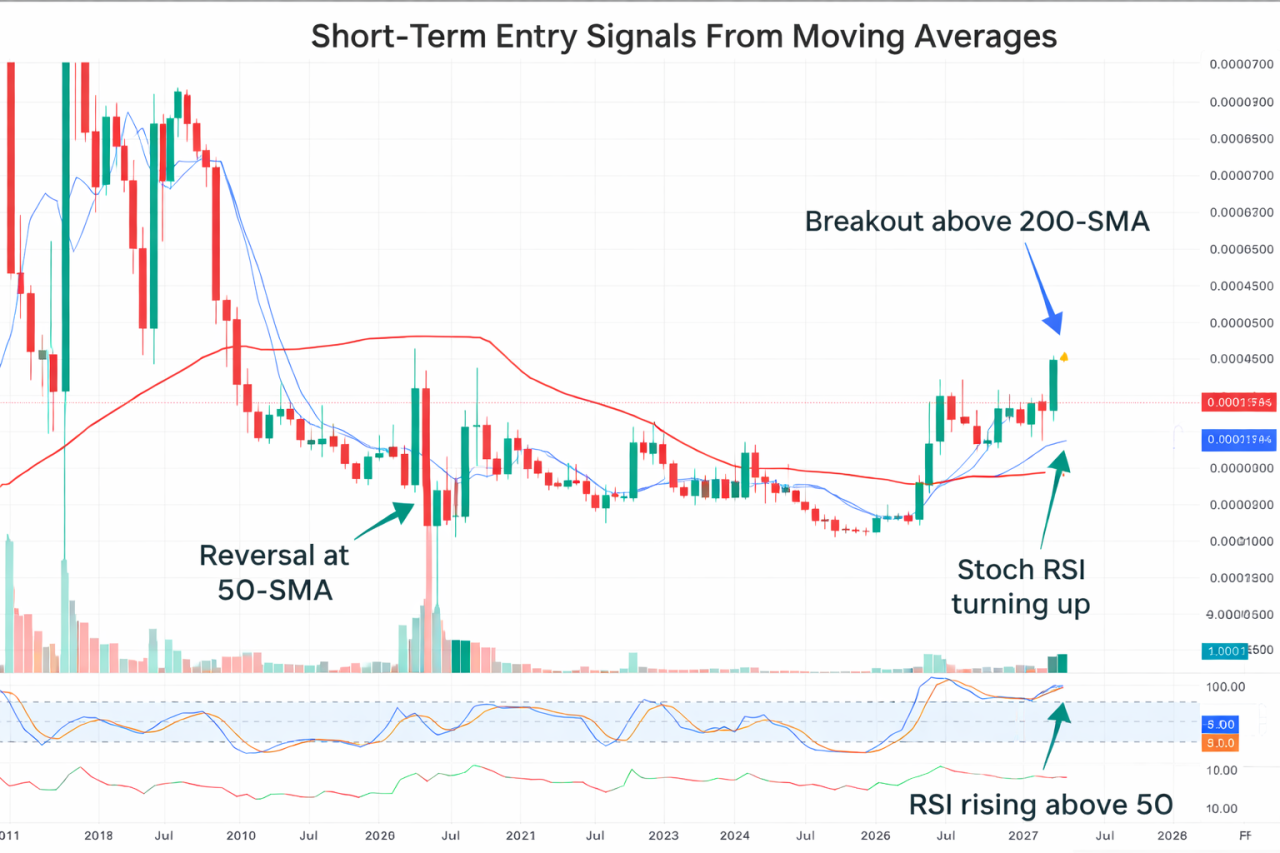
The 200-SMA works differently. A monthly close above it often signals a trend shift and attracts fresh buyers. Traders who want confirmation instead of early entries may wait for that breakout.
That said, a Stoch RSI move upward from oversold levels combined with RSI rising above 50 on smaller timeframes will likely lead to a bullish move.
Avoid entering based on a single indicator. Always look for confluence between price action, volume, and momentum before committing larger capital.
ALSO READ: XRP on Edge: Will Ripple’s Token Crumble Below $1 This Month?
Other Factors To Watch Before Pulling The Trigger
While charts give structure, timing improves when you combine technical signals with market context. The three factors below will help confirm whether an XRP setup has real strength or a higher risk of failure.
Bitcoin Trend And Market Direction
Bitcoin sets the tone for most altcoins. When BTC breaks key support, liquidity leaves smaller assets quickly. Even strong XRP setups can fail during broad market selloffs, so confirm BTC holds important levels before entering.
On-Chain Flows And Exchange Activity
Exchange inflows often signal potential selling pressure, while steady outflows can indicate accumulation. So, monitor wallet movements to understand whether large holders prepare to distribute or quietly build positions.
News And Regulatory Developments
Legal updates, partnerships, and major listings can move XRP fast. Sudden negative headlines can trigger sharp drops, while positive announcements attract buyers.
Always check recent news to avoid entering positions during unstable conditions.
YOU MIGHT LIKE: Is XRP Dead? Here’s Why Crypto Forums Are Going Crazy
Conclusion
The XRP/BTC monthly chart presents clear levels for timing entries. The long-term support around 0.00001 BTC represents a high potential accumulation zone when price shows strong rejection. Shorter-term opportunities exist around the 50-SMA for tactical trades and above the 200-SMA for confirmed trend shifts.
While momentum indicators can help refine timing, they work best when combined with strong volume and clear price structure. Bitcoin’s direction and major XRP headlines can influence outcomes, so you should confirm both before increasing exposure.
Use a phased buying strategy with clear stops to manage risk while allowing participation in potential upside.
Should You Invest In XRP Now?
Before you invest in XRP, you’re going to want to read our next premium crypto alert which will be published in the coming days. We will reveal key crypto assets to consider in 2026 with explosive potential.
Since 2017, InvestingHaven’s blockchain research service has been guiding investors through both bull runs and crypto winters.
Join eToro today and receive $10 in free crypto on your first deposit. Trade crypto, stocks, and ETFs with powerful tools and social investing features like CopyTrader™
Crypto investments are risky and may not suit retail investors; you could lose your entire investment. Understand the risks here

