It is so easy to get caught up in day-to-day price moves. Social and financial media make your head spin, every day again, with tons of information and data points of which at least 99% is useless. As per our 1/99 Investing Principles more than 99% of information out there is noise. That said, we often take a step back, and look at weekly charts to understand big picture trends and ensure we stay grounded. One conclusion that came out of our big picture analysis was the hyper bi-furcated state of crypto markets in 2022 which we documented in our 2022 crypto predictions. The other important thing is the pretty crucial point in which BTC (read: the entire crypto market) finds itself.
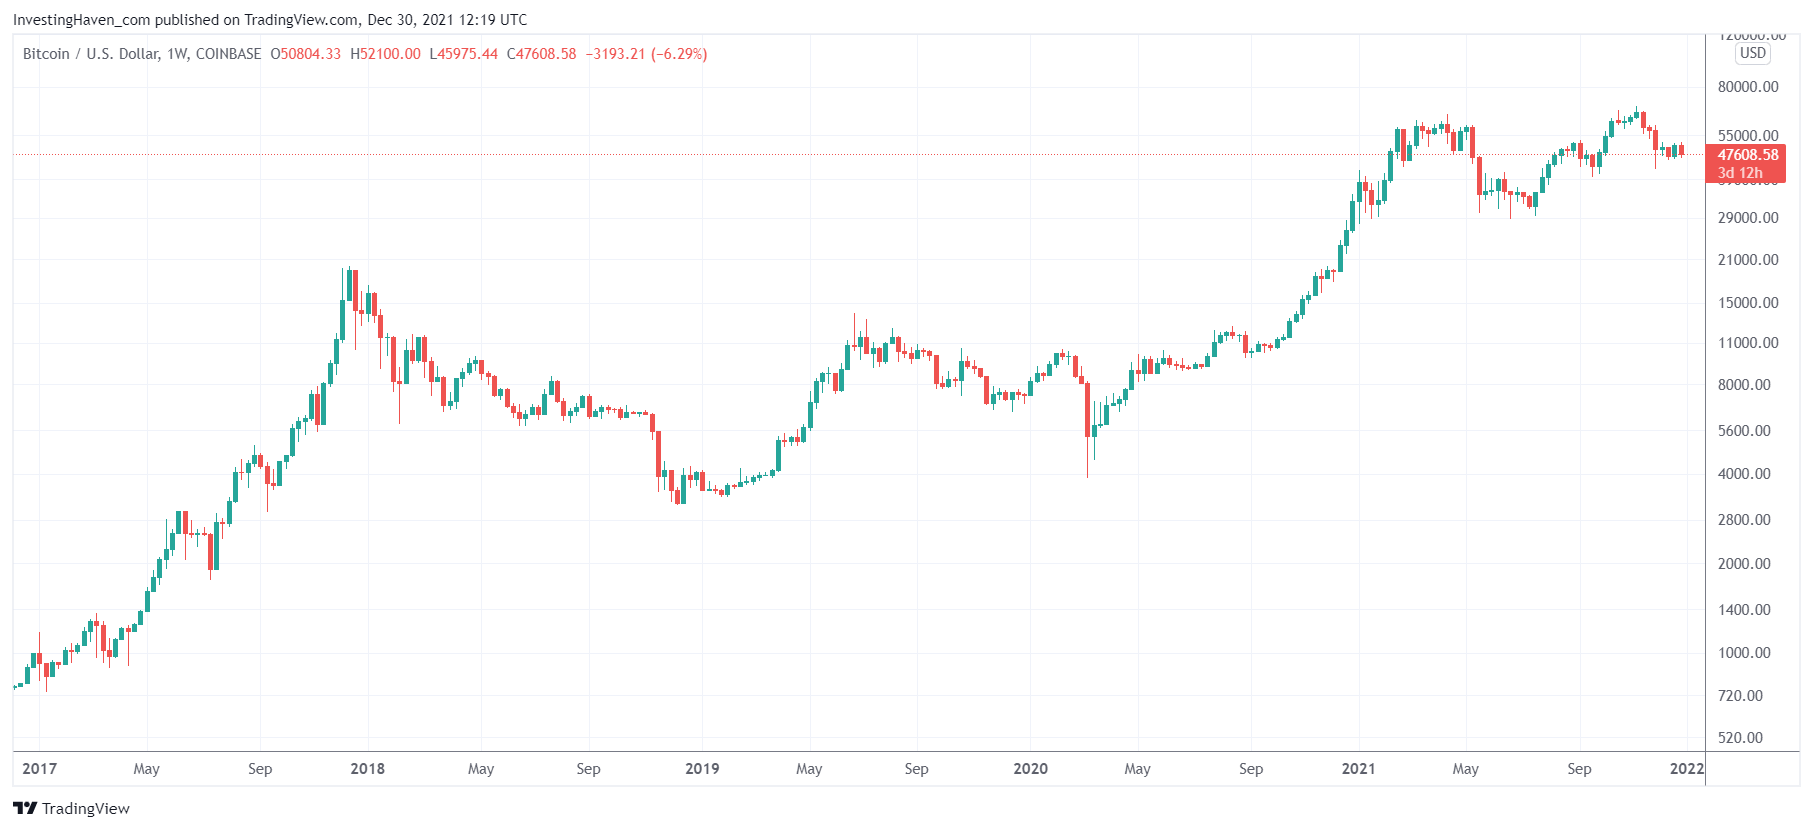
Below is the weekly BTC chart since 2017.
A few things stand out, from left to right:
- The exponential rise in 2017.
- The subsequent 3 year bullish reversal which many tend to call ‘bear market’ which in reality is a huge reversal.
- The accelerated move up starting in October of 2020.
- The struggles in 2021.
More importantly, presumably, is the current make or break level which you can clearly see on this chart. You don’t need a lot of imagination to understand that one or two lower red candles will turn this chart really bearish while one or two green candles will make this bullish.
And this one chart with this one simple conclusion really summarizes the state of the crypto market going into 2022. You don’t need to spend hours, wasting your precious time, following gurus / tracking blockchain data / analyzing leveraged positions in BTC futures and options market / de-ciphering language of whales.
Keep It Simple Stupid, also in crypto market analysis.
This one chart says it all, the rest is your own work: which coin to buy vs. hold, position size, exit strategy.
In our latest crypto analysis we summarized the charts of 30 coins. Only a handful have a promising setup, was the conclusion. In our premium service we will feature the latest tomorrow a few insightful BTC charts for the short term which help us understand the intention of BTC going into January.


