Crypto markets are going nowhere since mid-August. Since the September 7th drop the crypto market has been a mess, looking for direction, yoyoing between support and resistance areas, deceiving both bulls and bears. What’s next, is top of mind of crypto investors. The structure that our analysis brings into the charts might help solve this question. Frankly, we believe the situation is really simple and straightforward. It will be a matter of a few weeks until we understand entry opportunities.
First of all we have to reminder readers that crypto markets are only exceptionally really attractive. Moreover, and equally important, the big runs happen in a period of 3 weeks (ultimately in 3 months).
With that said it is easy to understand that it takes time for the major run to develop right after the extremely bullish period February/May of this year.
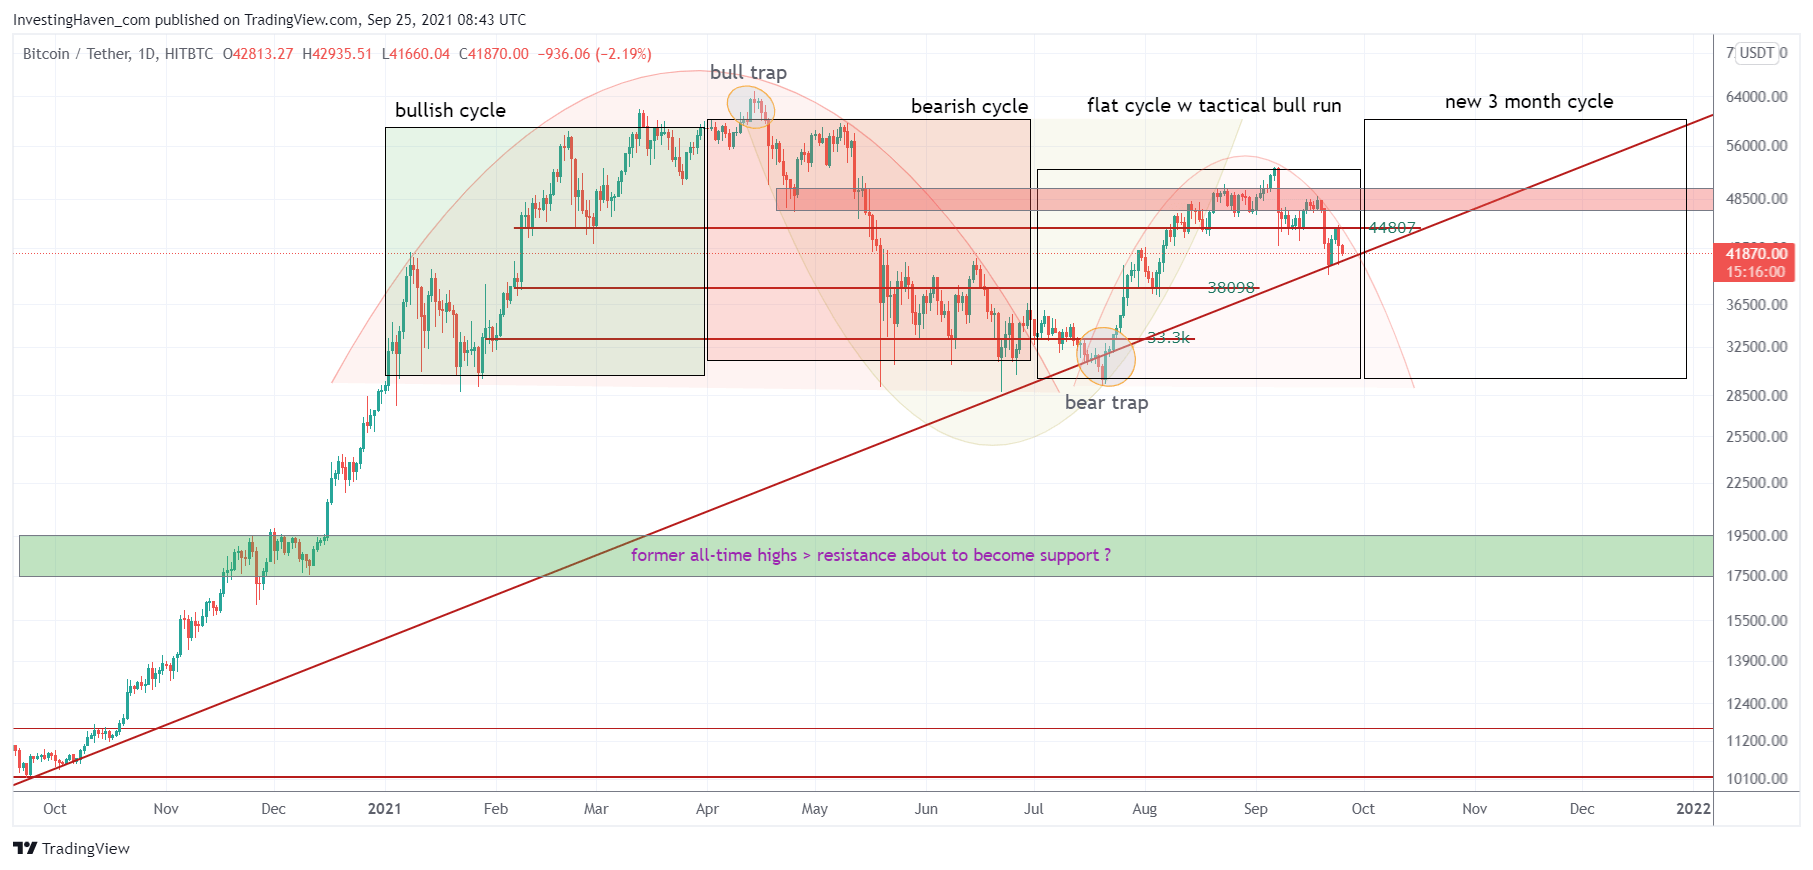
The easiest way to understand this is to create basic chart trends and structure them in 3 month periods (as per market cycles).
Below is the daily chart over the last 12 months which shows the last 3 cycles (also the one that is about to start on October 1st) as well as the basic trends.
The one important trendline to note is the rising red trendline which connects the start of a the really big bullish trend in April of 2020 with the lows of October of 2020 and the lows of July of 2021. A few days ago this trendline was touched, it did hold, but BTC must turn constructive anytime soon otherwise we can expect a prolonged consolidation in which case BTC will drop to 30k (in case of a bearish cycle we will see 18k-20k tested again, see the green bar on below chart).
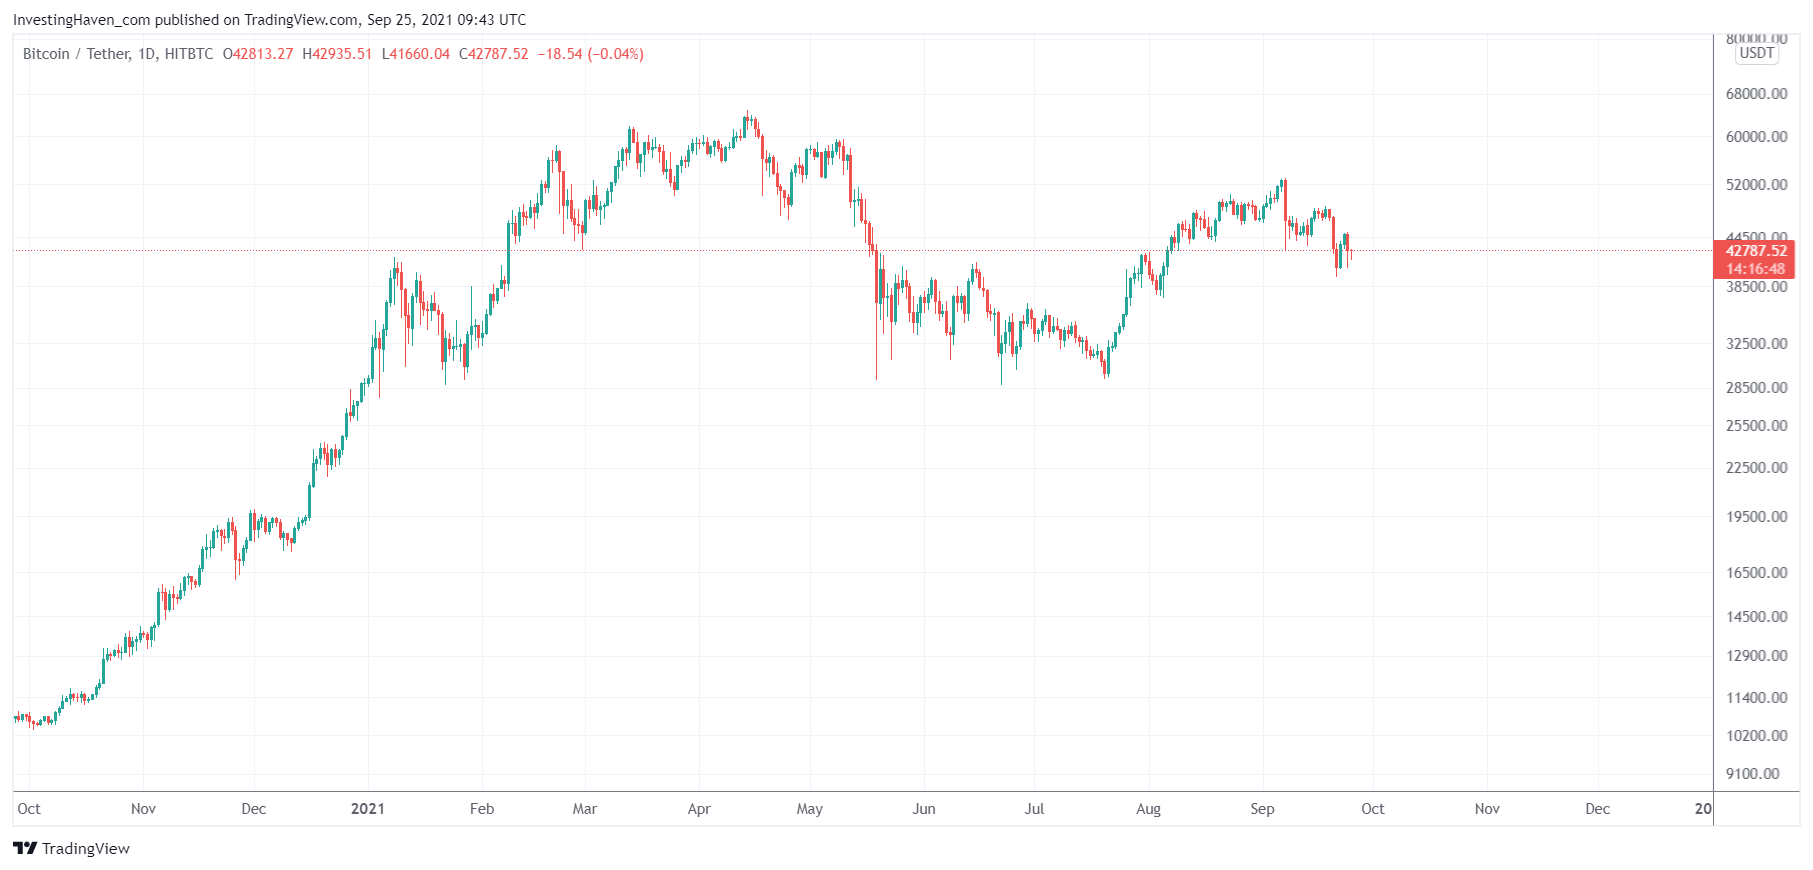
It is sometimes easier to remove all annotations. If we do so we get this chart setup. There are 2 ways to look at this. On the one hand this setup might suggest that the June resistance around 38k-40k is now going to become support. That’s the bullish outcome. However, in case 38k-40k does not hold it is clear that BTC will fall back to 30k-33k where it might create a bullish W reversal.
The most bearish case which is not to be expected (but we cannot exclude) is that 30k does not hold and this chart turns into a double top (with lower highs).
BTC will set the direction, altcoins will follow, that’s how it always goes and how it will go in the future.
The next few days, until approx. October 6th, will be about observing whether BTC will respect the 38k-40k area. This will help us understand if there is a bullish trend underway, a bearish trend or another flat trend for the next 3 months!
In our crypto investing research service we share this type of analysis, but with many more charts and deeper insights so our premium members understand when it is a good moment to get in, when it is a moment to reduce positions and when is a right time to focus on other things in life (because, like in September, there was literally nothing happening in crypto markets and it was a waste of time to be looking at crypto charts).


