
The price of Bitcoin is below its 200 day moving average since August 3d, 2024. Moreover, Bitcoin’s 200 dma is now turning flat which implies a flat long term trend confirmation. What’s much more important, however, is this one correlation chart: BTC vs. the Nasdaq. This is why.
RELATED – BTC price prediction 2025 and beyond
One important thing to realize as we look at moving averages is that they are lagging indicators.
In other words, the price of Bitcoin (BTC) may be below its 200 dma but what exactly does it imply, and what not?
Price of Bitcoin below its 200 dma
It is imperative to realize that lagging indicators are just that – lagging.
So, as crypto enthusiasts are primarily forward looking, it is even more important to ensure that the forward looking mind is interpreting a lagging indicator in the right way.
RELATED – Bitcoin (BTC) Price Fast Approaching A Critical Fibonacci Level: Concern, Opportunity Or Both?
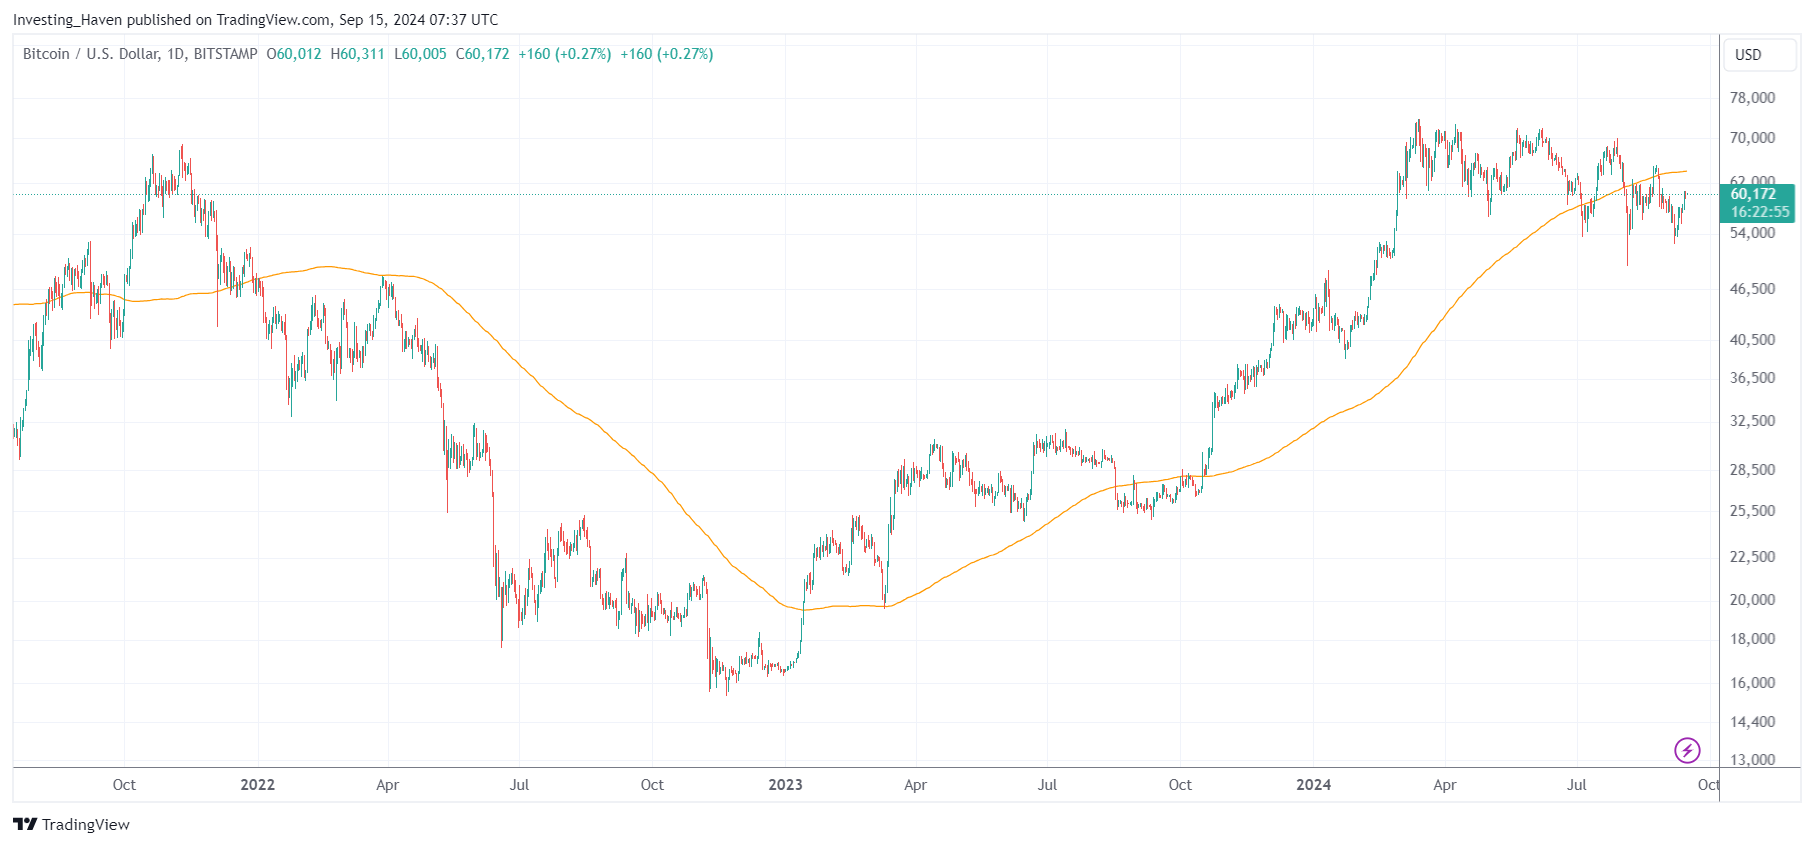
The BTC price chart with its 200 dma (orange line) is shown below. Two things stand out:
- BTC dropped below its 200 dma early August. Since then, it did struggle below it.
- Bitcoin’s 200 dma is now flat, since a few days. This will be reflected in trading algos, and bears will have an edge in the coming weeks.
Bulls will need to work much harder to create momentum, certainly as we are in a seasonally weak period now.
It’s pretty clear: the hope that BTC will hit $100k anytime soon is just that, hope. While BTC will hit $100k, it won’t happen in 2024.
RELATED – Will Bitcoin Ever Hit $1 Million? Here Is A Rational Answer.
The problem with the 200 dma is that it’s lagging so much that it is not a useful indicator in modern society.
It helps in story telling.
Serious investors are not interested in story telling.
We need a different type of data point to help us understand what’s next in BTC, and how long we have to wait for the next leg higher in Bitcoin’s secular bull market.
Bitcoin vs. the Nasdaq
Bitcoin is now strongly embedded into the financial system.
It started with the introduction of BTC futures, back in 2017.
Lately, with the advent of BTC ETFs, Bitcoin is more than ever before integrated into financial markets.
This implies that Bitcoin moves higher and lower if it makes sense relative to other markets. The Nasdaq is strongly correlated to Bitcoin, more than ever before in fact.
That’s why it doesn’t make sense to read too much into social media where $BTC is looked at in isolation. It’s bad, really bad, if you look at BTC without considering the rest of financial markets.
Again, BTC ETFs dramatically changed crypto market dynamics!
It’s called intermarket dynamics.
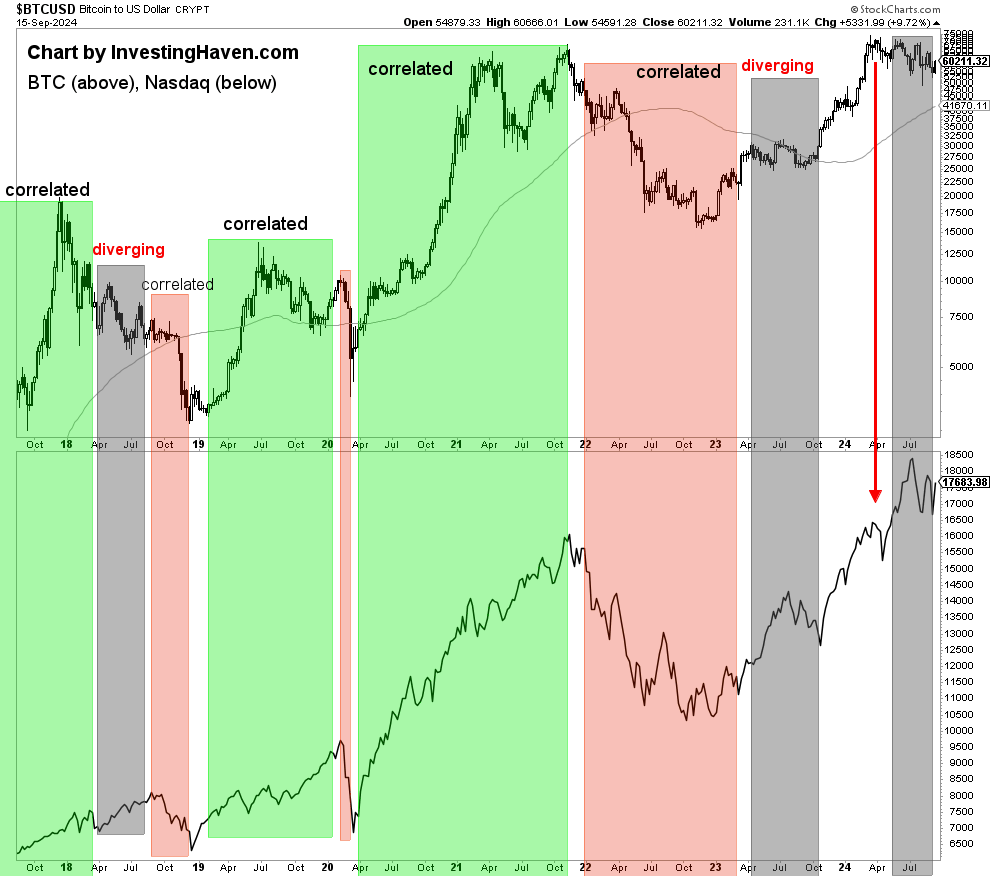
That said, what stands out is the correlation between BTC and the Nasdaq. Our chart, below, is an important one, really important:
- When BTC moves higher, much higher, it tends to happen in a RISK ON environment which is when the Nasdaq is also experiencing bullish momentum.
- BTC tends to diverge when it sets a top, typically a few months before the Nasdaq sets a top.
- BTC did set a top in March/April of 2024. The Nasdaq moved higher since then, but is struggling.
This chart is immensely important, and 100x more important and insightful than Bitcoin’s 200 dma.
Bitcoin in 2025 – bullish, bearish, neutral?
Serious crypto investors will love the above chart.
In today’s crypto alert, shared in our premium research service, we shared a similarly important chart. The alert The FOMO Checklist + The 5 Tokens At The Top Of Our Shortlist is the type of research that every serious crypto investor should read. The research note is instantly available in the restricted area, upon sign up.
While the above may sound concerning, it is healthy price action.
Let’s face it – BTC went from 17k to 72k in some 16 months. This market deserves a break.
What many investors don’t realize is that long breaks are very healthy – the longer the break, the stronger the subsequent trend.
While we remain firmly bullish for 2025, we prefer to be cautious in the short term, with a slightly bearish stance, even with buy the dip strategies. In fact, we have a shortlist with only 5 tokens that qualify as a buy the dip, as mentioned above these 5 tokens are available in the research area of our website.
Long term bullish, short term very selective, that’s how we summarize the conclusions from the charts in this article.

