
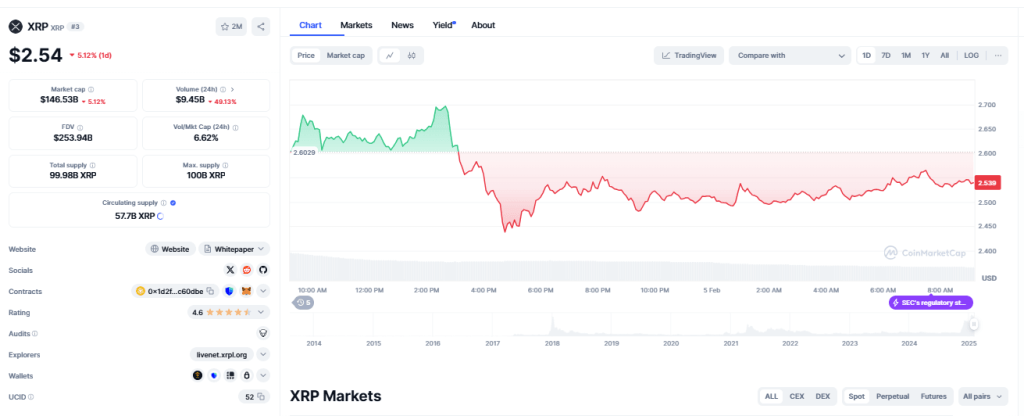
XRP has lost more than 5% in the 24 hours, crushing investor hopes of a speedy rebound towards $3 after Ripple Network suffered a 64-minute outage.
XRP’s woes continued for the second day running, as its price tumbled by more than 5% to settle around $2.5 (at press time). This saw crypto traders shun the digital asset, a move that saw it shed as much as 50% of its daily trade volume.
Two key factors may explain much of this bearish stance towards Ripple. The first was yesterday’s network drift that caused a temporary halt in block production on the Ripple ledger. This outage lasted for 64 minutes on February 4, effectively affecting over 80,000 XRP transactions.
This isn’t the first time the Ripple network has experienced serious issues, as it suffered similar outages in September and November 2024. The incidences had investors spooked and questioning Ripple Ledger’s reliability. Among the individuals who voiced reliability concerns while questioning Ripple’s transparency was Riot Platforms Vice President Pierre Richard, who asked when Ripple would publicize a post-mortem analysis of the incident.
The second is that the market hasn’t fully recovered from the shock of the Trump tariff. Top altcoins, including Solana and Chainlink, are equally down by a similar margin. Their daily trading volumes have also taken a hit, which may be explained by the cautious ‘wait-and-watch’ mood gripping the crypto market.
Will XRP Bounce Back Above $3?
Several fundamental factors, including growing optimism towards a positive outcome of the SEC vs XRP case and the listing of an XRP ETF in Canada first and later in the US, have investors convinced Ripple will recapture the elusive $3 mark before exploding to new highs.
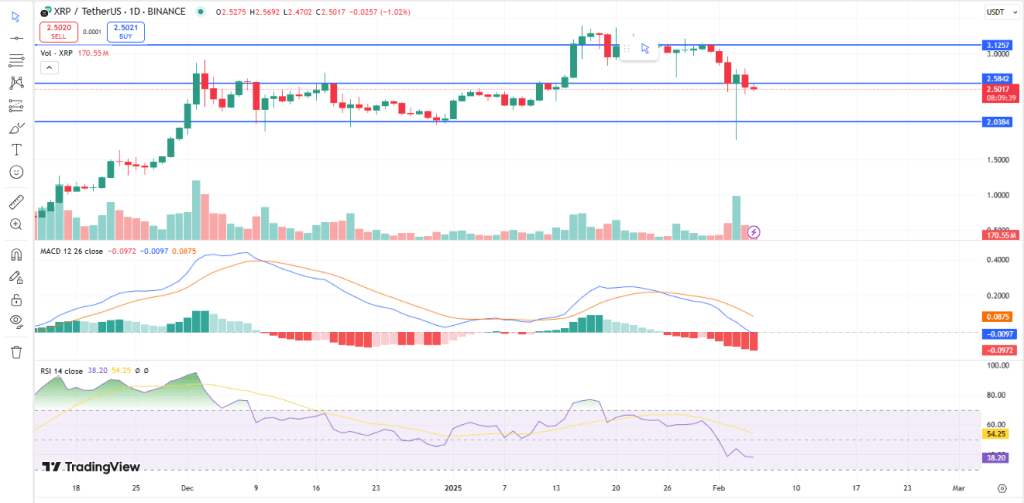
However, technical analysis points to an increasingly bearish investor sentiment towards XRP. For example, the MACD histogram – on the 1-hour time frame – has been printing red bars for over a week. Further, the MACD line has just crossed the signal line on a downward trajectory. It also has an RSI of 38, accurately capturing the massive sell pressure currently exerted on the coin.
🚀 Stay Ahead of the Crypto Market!
Join our Premium Crypto Newsletter and receive expert market analysis, insights, and early signals for the next big rally. Don’t miss out on profitable opportunities!

