The price of BTC came down from its all-time highs, after 4 failed attempts to move to new highs in 2024. This time around, the $60k level is being threatened. This is why BTC is down again.
Ed. note – Going forward, all Bitcoin price drop updates and alerts will be shared through this article which will be updated frequently Why Are Bitcoin (BTC) And Crypto Prices Down?
Crypto investors tend to always ask the question “what happened” when the price of Bitcoin is down. Instinctively, many tend to turn to X for BTC analysis. Needless to say, it is impossible to provide a thorough analysis to understand why BTC is down in a tweet.
This article provides a detailed examination of the factors contributing to Bitcoin’s (BTC) recent decline in value. It helps crypto investors understand what truly is going on; it explains the current conditions and market environment making it almost an inevitable outcome for the price of Bitcoin to drop.
The author, Charlie Morris, explores the relationship between Bitcoin and broader economic indicators, highlighting how the cryptocurrency responds to changes in inflation, interest rates, and overall economic growth.
This analysis is grounded in the concept of “hot money,” which refers to periods when the financial system is flush with cash, leading to rising short-term interest rates and inflation.
Bitcoin’s macro picture: Bitcoin loves hot money
The Money Map, which I often refer to in The Multi-Asset Investor, explains the regime that fits the asset classes. Bonds and equities like low inflation, as they are financial assets, and do well when fiat money is holding up. In contrast, Bitcoin and gold like inflation higher, as they become stores of value during periods of fiat debasement. But as we move to the x-axis, Bitcoin and gold differ. Bitcoin likes rising rates because that happens when the world is awash with cash and the economy is growing. In contrast, gold likes the economy when it’s weak and rates are falling.
The Money Map
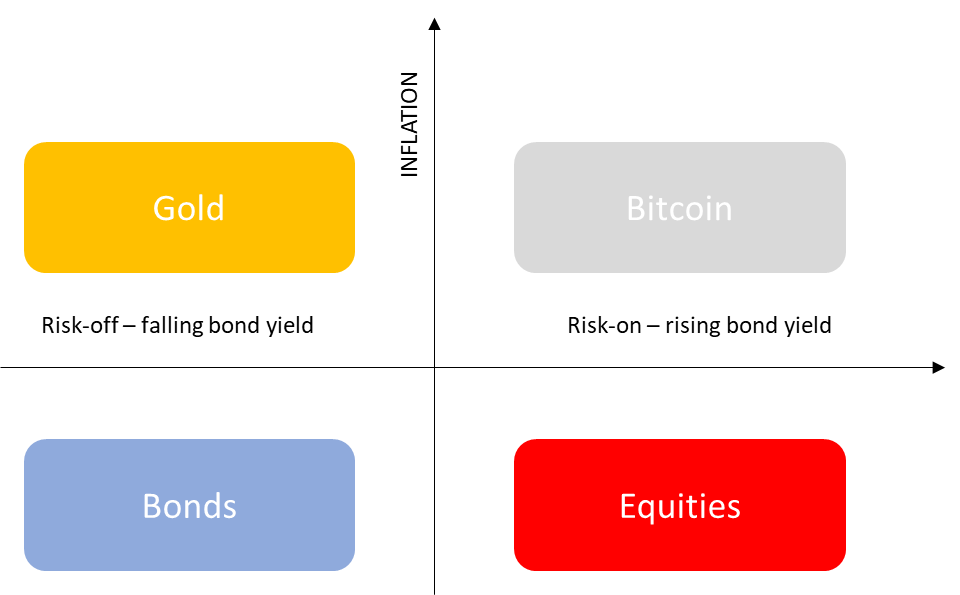
Source: ByteTree
I repeat this because many investors seem to think that Bitcoin likes rates to fall, whereas this thesis suggests it wants them to rise. There’s one other difference between what ATOMIC believes about Bitcoin and mainstream opinion. Bitcoin is much more sensitive to short-term rates, whereas gold is linked to long-term rates.
To illustrate this on Bitcoin, the two-year US bond yield (black) is added to two-year inflation expectations (blue), which becomes a sort of hot money index (red). In simple terms, the higher rates and inflation are, the more money there is in the system. The chart starts in 2005 to illustrate the freezing of the economy in the 2008 credit crisis, and the buoyancy beforehand.
Hot Money Using Two-Year Rates and Inflation
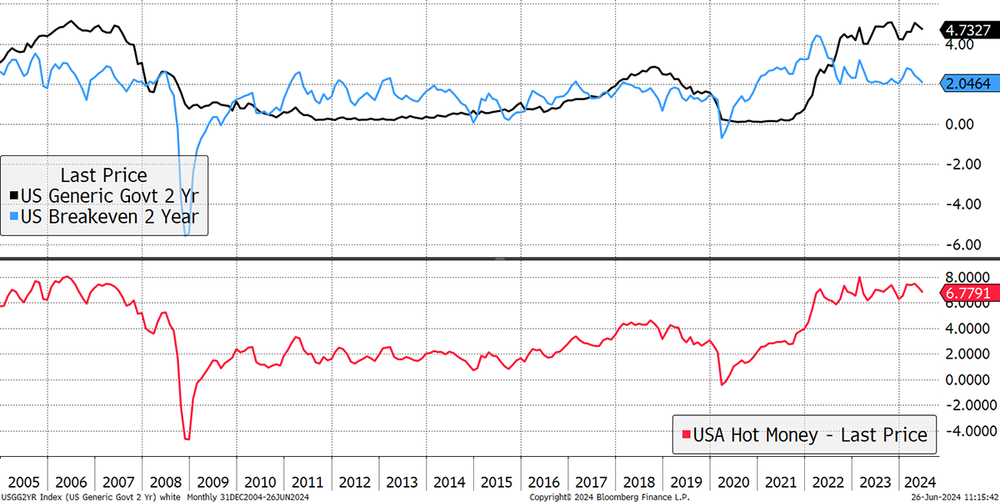
Source: Bloomberg
I will next overlay the hot money with Bitcoin. The link is imperfect, as there are many other influencing factors that matter, but it’s pretty clear there’s a link. The blue boxes highlight Bitcoin bull markets, which have tended to coincide with the amount of hot money in the financial system.
Bitcoin and Hot Money
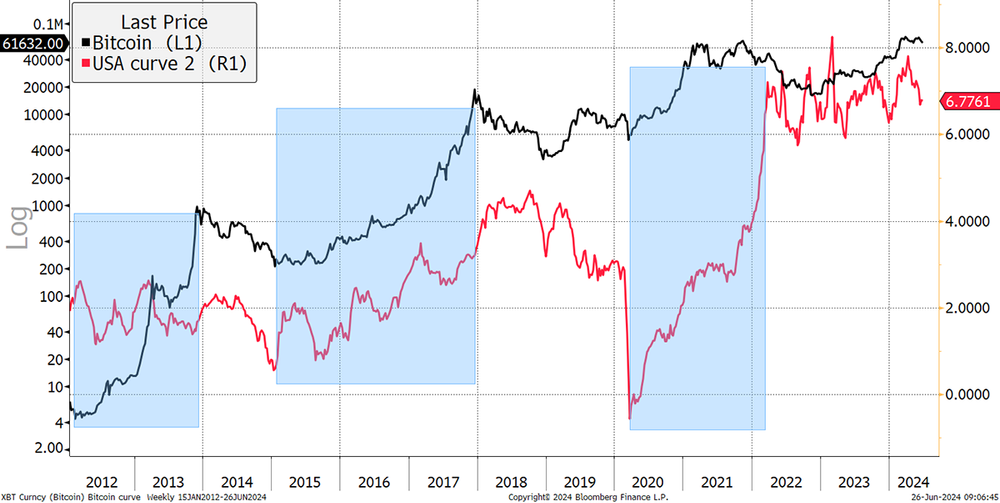
Even more impressive are the links with Bitcoin bear markets. In both 2014 and 2018/9, we saw rates and inflation turn down, coinciding with a period of Bitcoin weakness. When the reading went negative in March 2020, Bitcoin crashed, just as it did in November 2014. The 2020 bull market followed rates and inflation higher until early 2022 when the situation had stabilized. Now the hot money is falling again, from very high levels. If you believe that inflation is contained and rates are headed back to the floor, then Bitcoin is in for a rough ride.
I don’t.
Canada cut rates last month as they felt the inflation battle had been won as it fell to 2.3%. Then inflation was published yesterday at 2.6% for the year and 0.6% for the month. There’s a chance they have moved to cut too early. But then, the developed economies can’t afford high interest rates for much longer, and so the system will force cuts, which will allow inflation to resume. The hot money indicator can remain still with lower rates, provided higher inflation can offset it.
This all comes back to the economy and nominal GDP growth. The economist Knut Wicksell suggested that interest rates should approximate the level of nominal GDP growth (real growth and inflation). This idea is linked and is something we see routinely in the emerging markets whereby rates and inflation remain structurally higher than in developed markets. I do not see how such an environment could be bad for Bitcoin.
Bitcoin price down: Bitcoin’s technicals neutral
Yet the trend has weakened. Bitcoin’s price is hovering around the 200-day moving average, which is close to a support level. We cannot ignore the failure to make a new high after March. There were four attempts and they all failed.
Bitcoin 2/5 trend score
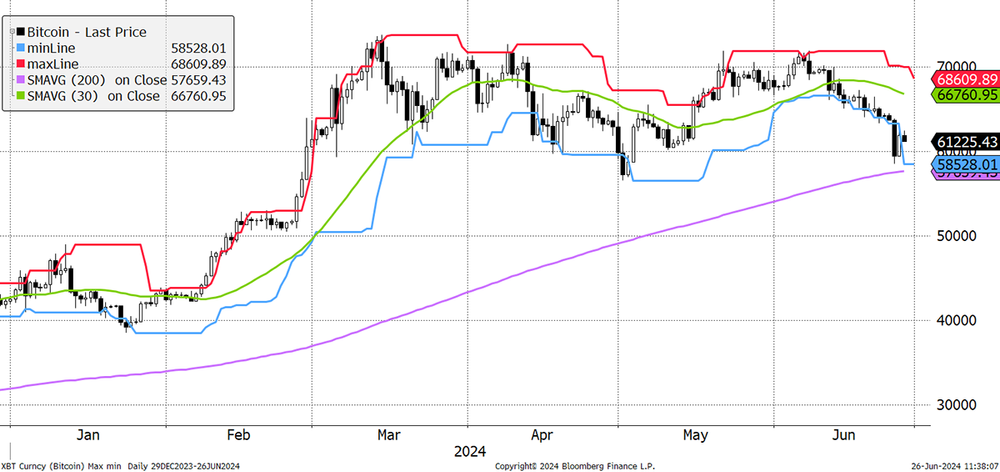
Source: Bloomberg
The $60k zone ought to hold, but it doesn’t have to. It could well be an early warning for markets in general. Bitcoin has historically been a useful leading indicator.
Then there’s the divergence with the Mag 7 stocks (NVDA, AAPL, etc.). The correlation is clear, yet Bitcoin has turned down. More importantly, and notwithstanding the leading indicator possibility, the lower blue line is half the level it was in 2021 when Bitcoin was last riding high.
Bitcoin and the Magnificent Seven
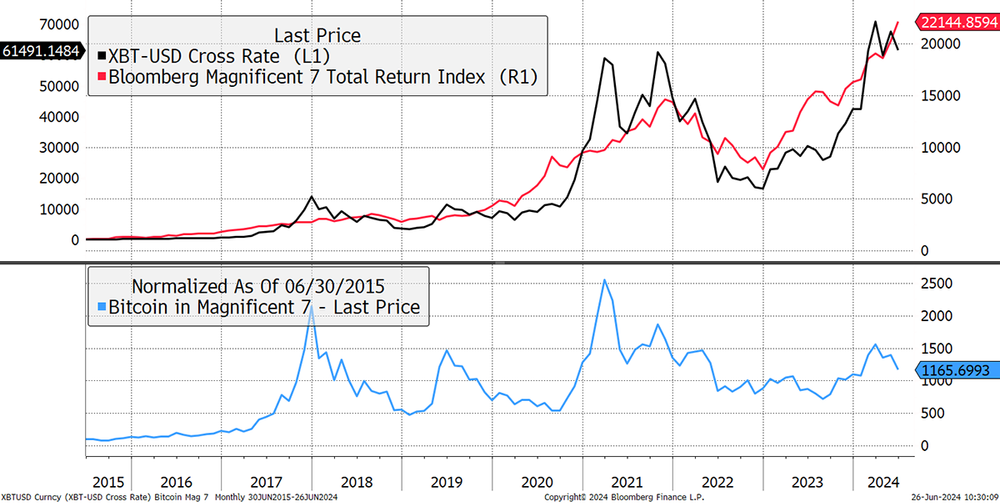
Source: Bloomberg
Is that a tough comparison? Potentially. We shouldn’t be concerned about the lag because AI currently has the spotlight while Bitcoin is back in the shadows. That will change, but perhaps not for a while. We should also consider the dollar, which is shown inverted in the chart below. A strong dollar has been bad news for Bitcoin.
Bitcoin and the Dollar
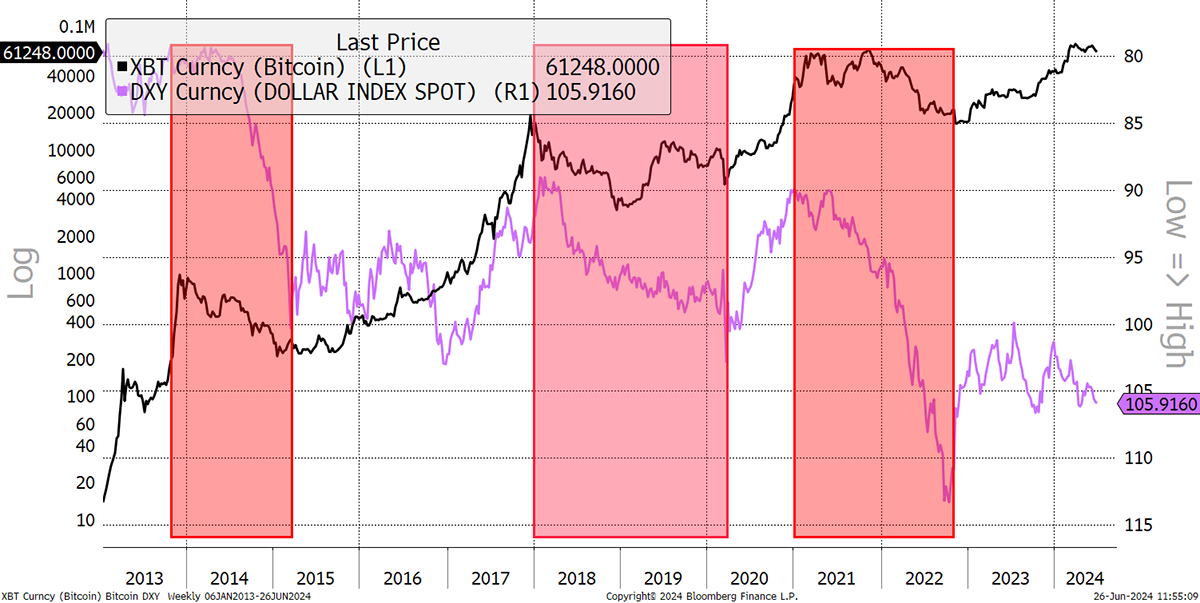
Source: Bloomberg
And we have a strong dollar. The trends are positive and a break higher could happen at any time.
Dollar Index 5/5 trend score
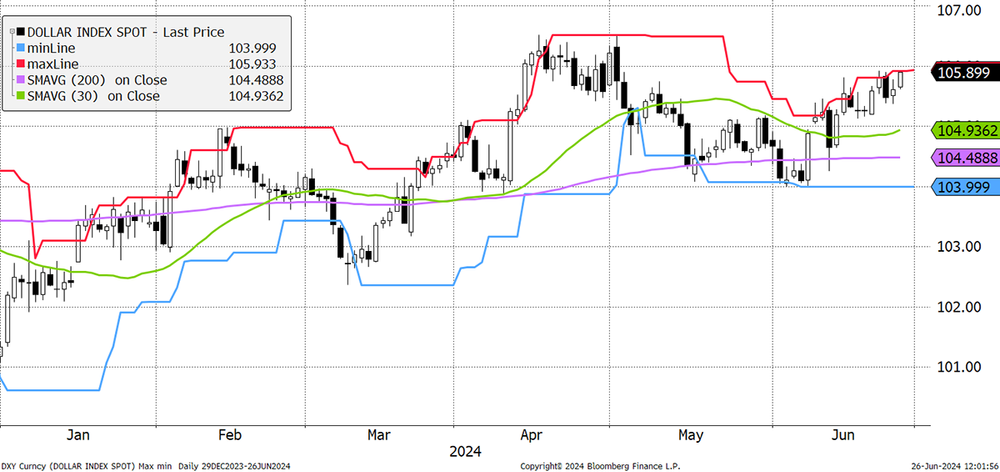
Source: Bloomberg
Bitcoin investment flows: neutral
The super-strong flows in February and March, caused by the new ETFs, are over. There was another brave effort recently, but that’s over too. The Bitcoin network is currently seeing modest outflows.
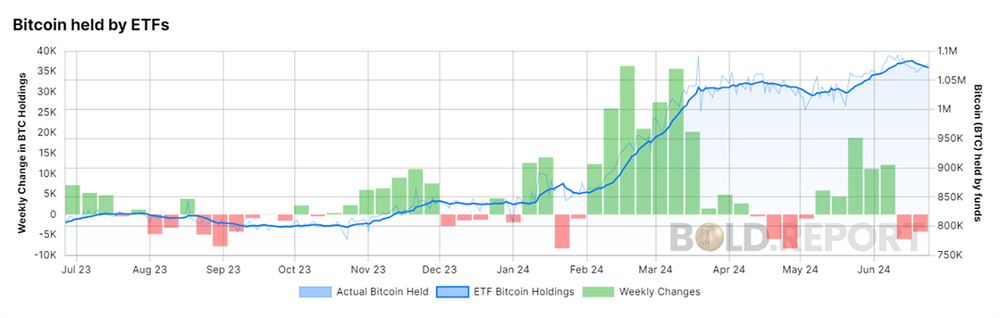
Source: BOLD.report
That can be confirmed because just as Bitcoin and Gold have low price correlation, so do the flows it seems. As investors face lower rates, they have stopped selling the gold ETFs and are starting to allocate. It will be interesting to watch these flows battle it out.
Conclusion: Why the price of Bitcoin is down… again?

