The Crypto Market this week, Will Bitcoin extend last week’s gains to the third week of May, and what is happening to gold? Does it have what it takes to escape consolidation?
Bitcoin and Gold are two of today’s premier investment assets. But their price is inversely correlated, as are the many factors that impact their price action.
This explains why Gold prices set out on an aggressive price rally between early February and May, when Bitcoin prices were taking a beating. But now that macro factors are improving, Gold’s price action has been on a downtrend and is now consolidating.
How will the two assets perform this week?
Bitcoin’s Most Likely Price Action Today
After the China-US truce less than a fortnight ago, Bitcoin started rallying and even broke above $100k for the first time in close to two months.
Throughout last week, the top crypto leveraged the positive news to climb above $106,000 to test the new resistance level of $107,000.
During the first day of this week, Bitcoin broke above this key resistance level when it reached an intraday high of $107,068. This places the legacy coin less than 6% away from the all-time high of $109,111 set in late January.
Looking forward, we expect Bitcoin to continue inching closer to setting a new price record. We, for example, expect it to reach $108,000, driven by more positive macros, such as the upcoming jobless claims report.
Our analysis is backed by the bullish technical indicators that the BTC chart continues to display, especially on the daily timeframe.
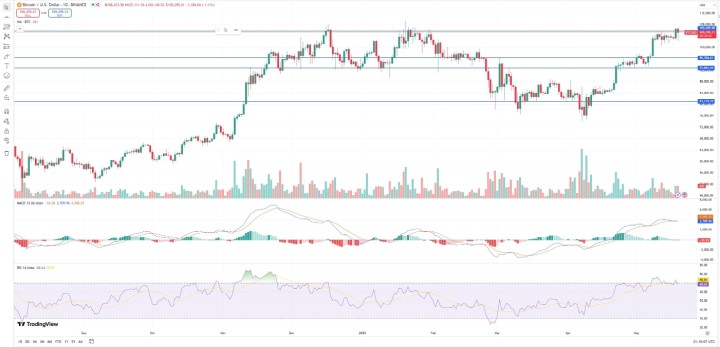
The MACD, for instance, is achieving convergence in the positive territory as the MACD lines cross the signal line from below. The RSI is also teetering close to the oversold territory of 70, having risen gradually from below 50 in early April.
Gold Most Likely Price Action This Week
Gold’s aggressive value gain over the past 5 months was driven by the barrage of negative news that was hitting the markets.
The biggest of these is the risk of inflation as a result of the antagonistic Trump tariffs. It, therefore, was only natural for the yellow metals prices to enter into a consolidation phase as soon as these macros started improving.
At the time of writing, gold trades around $3,230 and has been stuck at this price level for more than a week.
The consolidation was preceded by a month-long downtrend from the price record of $3505 set early last month.
From a technical perspective, investor sentiment toward the precious metal is crashing, as evidenced by the bearish indicators.
The metal’s RSI reading, for example, has moved from an oversold region of 76 a month ago to around 48. The MACD has also dipped significantly and is now heading into negative territory. The MACD histogram has also been getting taller and redder over this period.
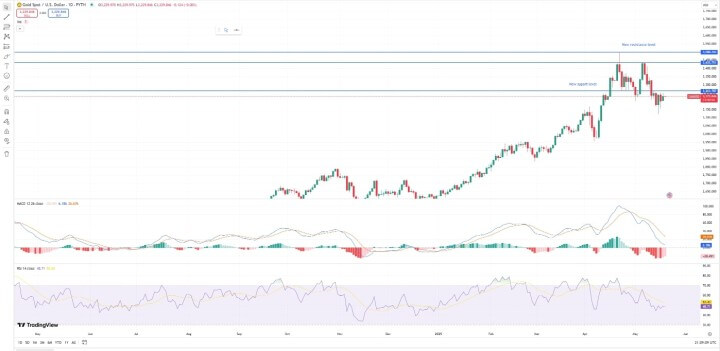
Absent of more positive macro news, we expect Gold to extend this consolidation phase and continue trading around this price level.
Any more bearish news for gold may, however, see it drop the precious metal’s drop to the lower support level around $75.
Best Gold Trading Platform for Intermediate Traders and Investors
Invest in gold and 3,000+ other assets including stocks and cryptocurrenncy.
0% commission on stocks - buy in bulk or just a fraction from as little as $10. Other fees apply. For more information, visit etoro.com/trading/fees.
Copy top-performing traders in real time, automatically.
eToro USA is registered with FINRA for securities trading.
30+ million
Users worldwide
Join Our Premium Research on S&P 500, Gold & Silver — Trusted Insights Backed by 15 Years of Proven Market Forecasting
Unlock exclusive access to InvestingHaven’s leading market analysis, powered by our proprietary 15-indicator methodology. Whether it’s spotting trend reversals in the S&P 500 or forecasting gold and silver price breakouts, our premium service helps serious investors cut through the noise and stay ahead of major moves.
- Gold Close To Hitting Our First Downside Target. Silver Remains Undervalued. (May 18)
- A Divergence In The Precious Metals Universe (May 10)
- Gold Retracing, Silver and Miners at a Critical Level (May 4)
- The Precious Metals Charts That Bring Clarity Through Noise (April 27)
- Highly Unusual Readings In Gold & Silver Markets (April 20)
- Gold Miners Breaking Out, Here Are A Few Gold Stock Tips. What About Silver & Miners? (April 13)
- Gold, Silver, Miners – Bottoming or More Downside? (April 5)
- Why Next Week Matters for Gold — But Less So for Silver (March 29)
Unlock Premium Market Insights

