Bitcoin dominance is one of the most important concepts for crypto investors. Rising Bitcoin dominance tend to coincide with ‘risk off’ periods while rising readings tend to coincide with alt seasons. In a way, Bitcoin dominance readings can help tremendously understand when to be more bullish or turn more defensive, as a crypto investor.
RELATED – The Crypto Bull Market 2024 Is Here. It’s An Hidden Bull Market.
Understanding Bitcoin dominance
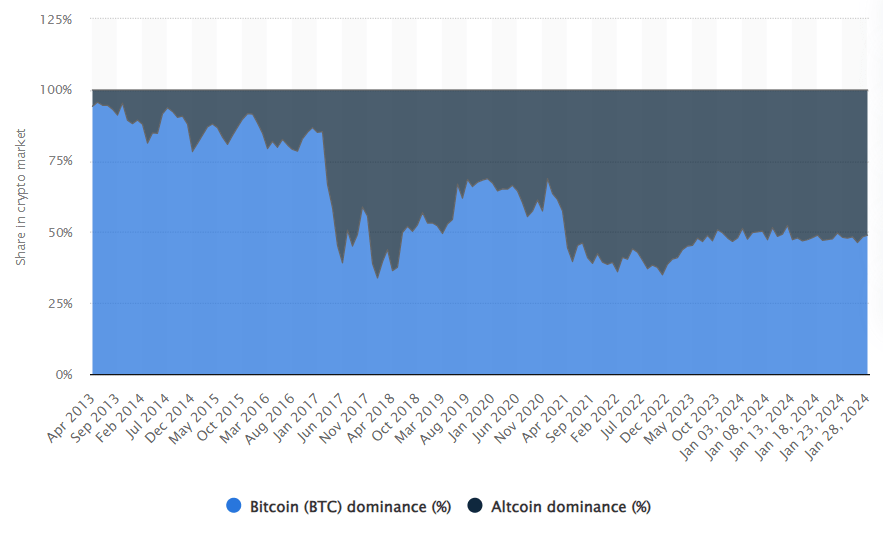
Bitcoin dominance is a metric that represents the market capitalization of Bitcoin in relation to the total market capitalization of all cryptocurrencies combined. It’s essentially a percentage that indicates how much of the entire cryptocurrency market is dominated by Bitcoin.
This metric is calculated by taking Bitcoin’s market cap and dividing it by the total market cap of all cryptocurrencies. For example, if Bitcoin has a market cap of $1 trillion and the total cryptocurrency market cap is $2 trillion, then BTC dominance would be 50%.
BTC dominance since 2013
Bitcoin (chart)

Why Bitcoin dominance matters to investors
Bitcoin dominance is a crucial indicator for investors in the cryptocurrency space. It provides insights into the relative strength and influence of Bitcoin compared to other cryptocurrencies:
- High Bitcoin dominance often suggests a market where Bitcoin is the predominant player, and its price movements can significantly impact the entire market.
- Conversely, a decrease in Bitcoin dominance might indicate a growing interest in alternative cryptocurrencies, signaling shifts in market trends.
For serious investors, monitoring Bitcoin dominance is essential for making informed decisions about portfolio allocation and understanding the broader dynamics of the cryptocurrency market. It serves as a valuable tool for gauging the overall health and sentiment of the crypto market.
As a consequence of this, we believe that Bitcoin’s dominance can be used as a relevant indicator for when an altcoin season can start. Typically, when dominance of BTC drops, when combined with crypto market momentum, it implies that some altcoins are ready for big moves, really big moves.
Secular trend as it relates to Bitcoin dominance
While the above chart showed dominance of ‘King Bitcoin’ as a ratio against the rest of the crypto market, we now look at dominance from a different perspective.
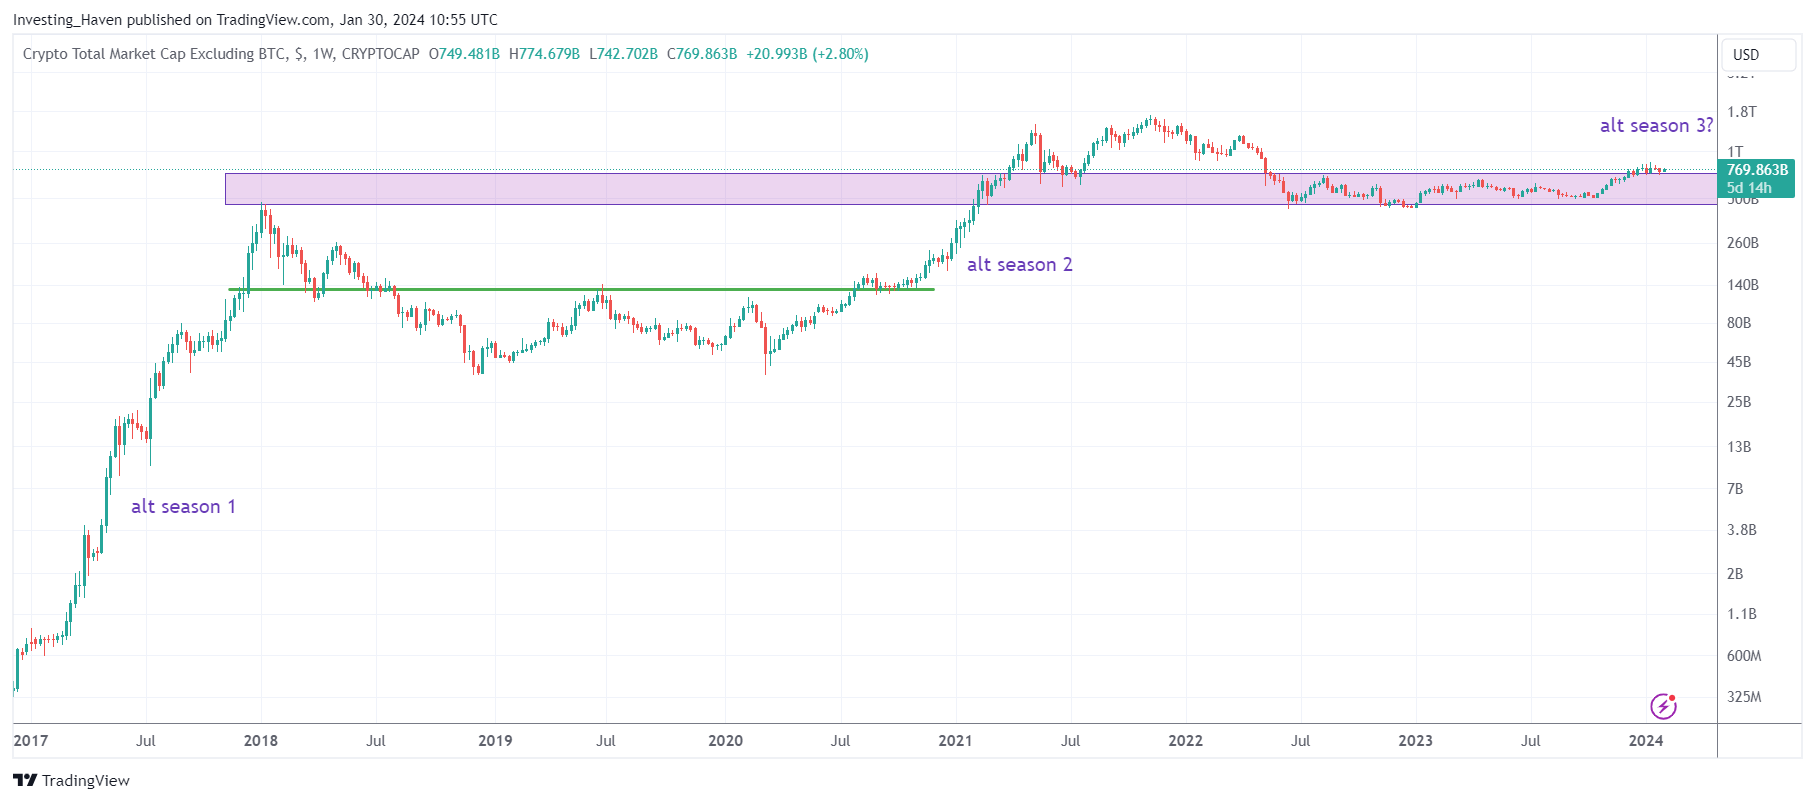
Below is the chart that shows crypto’s market cap (source).
It is a secular chart of the crypto market cap excluding BTC.
The combination of the previously shown chart (BTC as a % against the rest of the crypto market) with the total market cap excl. BTC paints a great picture of where the real opportunity lies: altcoins, Bitcoin, none.
As seen, every time the total market cap excl. Bitcoin started rising, we got an ‘alt season’ in which altcoins were explosive. This happened twice.
What’s interesting and useful about this chart is that you can use classic chart analysis to understand, even forecast, when BTC is dominant vs. when momentum kicks into the altcoin market.
The W-reversal in the period 2018-2019 was a great heads-up signal that an alt season was about to start soon. Eventually, once the breakout of crypto market excl. BTC occurred, towards the end of 2020, altcoins broke out. The rest is history.
What’s interesting to note is that the current breakout attempt of alts vs. BTC is ongoing since a few months. It is happening slowly but surely, BTC is dominance fading against the rest of the crypto market. Eventually, alt season 3 should start.

BTC dominance more recently
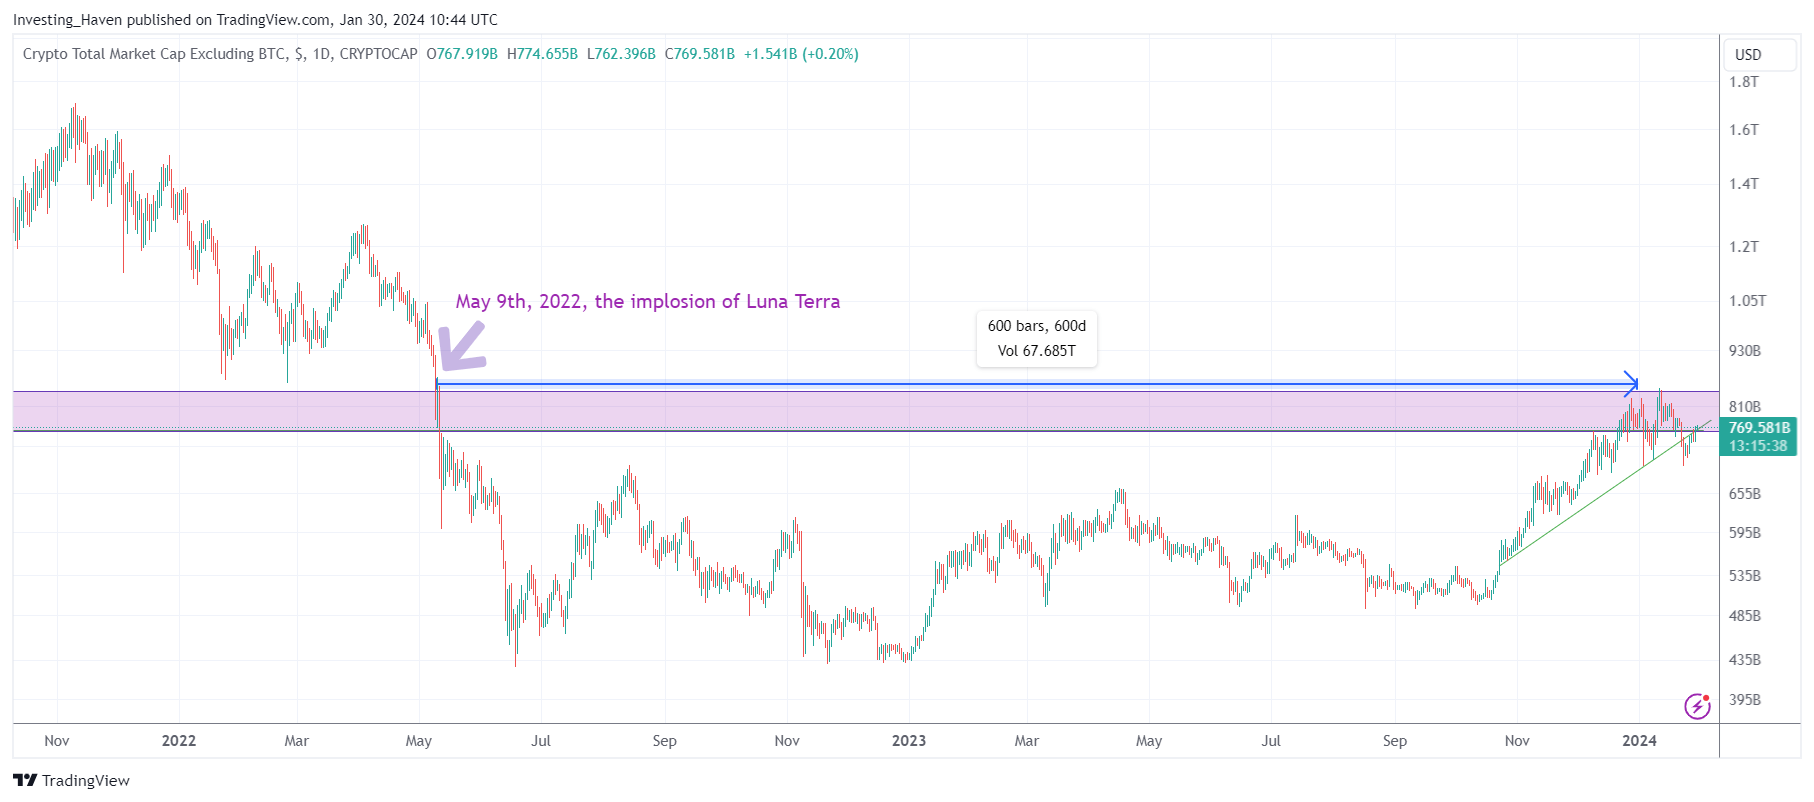
We now zoom in to see what is happening in the last 2 years. Essentially, as seen on the above chart, we can reasonably expect that an alt season is brewing.
What we need is classic chart analysis: a bullish reversal on this crypto market excl. BTC chart suggests a rising probability of an alt season underway.
The most interesting part is the 600 day consolidation since Luna Terra’s implosion is now coming to an end. We emphasize 600 because it’s a strong number, and it could amplify the thesis of the switch from BTC to altcoin dominance.
Between May 9th, 2022, until the BTC ETF approval, BTC has been dominant. This 600-day period might be coming to an end now. Altcoins might be shining in 2024.

Breakdown of dominance in BTC vs. alts ongoing
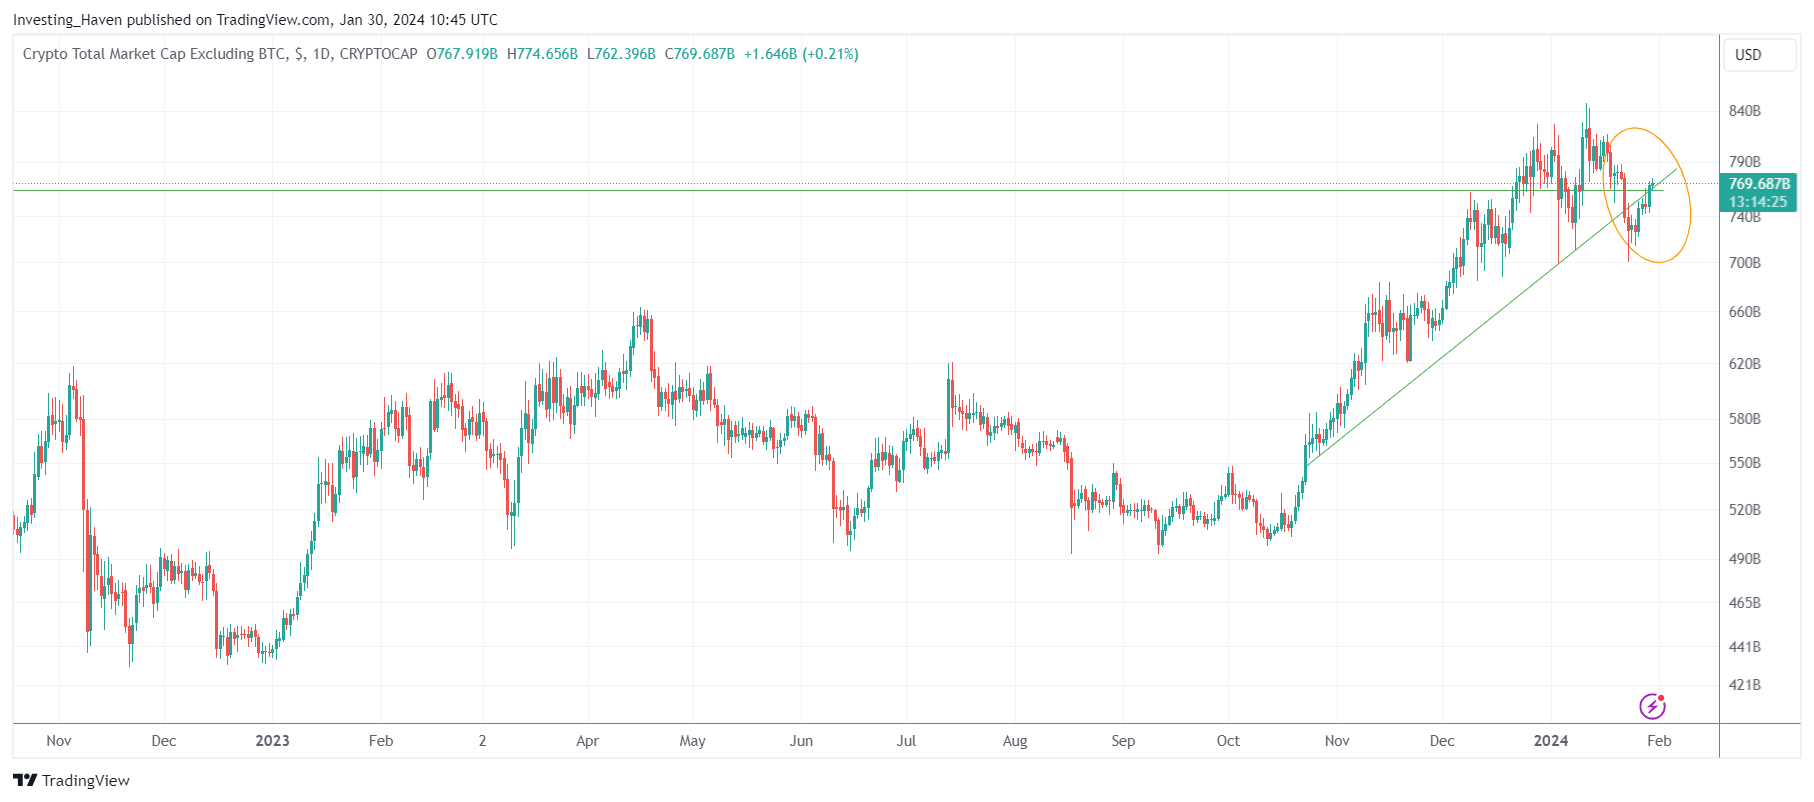
If we zoom in a little more, on the same chart (crypto market cap vs. BTC) we can see how BTC is now in a serious fight to keep its dominance going.
BTC dominance peaked on January 1st, 2023. Altcoins have been increasingly winning in strength since then.

Interpreting dominance ratio with market cap chart
The interplay between Bitcoin dominance and the crypto market cap, excluding Bitcoin, unveils crucial insights for crypto investors.
This is the general rule of thumb we derive from the points made in this article:
- Risk-off, BTC dominant. High Bitcoin dominance signals a market where Bitcoin’s influence is predominant, impacting overall market movements. This tends to occur when BTC dominance exceeds 50%, and the total crypto market chart is consolidating or declining on the total market cap chart (excl. BTC).
- Risk-on, BTC losing dominance. The dynamic shifts when examining the total market cap without Bitcoin, as rising figures suggest the potential for explosive altcoin movements. Historical patterns on the total market cap chart, such as the W-reversal, serve as indicators of impending alt seasons.
Presently, as BTC dominance faces challenges and altcoins exhibit strength in a long ‘battle’ that is ongoing for 600 days now.
The total crypto market is on the cusp of a shift.
The ongoing battle: BTC vs. Altcoins
As evidenced by the charts in this article, a breakdown of BTC dominance against altcoins becomes evident. This trend is ‘brewing’ since 2 years.
BTC dominance reached its peak on January 1st, 2023, and since then, altcoins have been steadily gaining strength. The market is witnessing a serious contest between Bitcoin and altcoins for dominance.
As the crypto landscape evolves, this battle holds significance for investors, signaling potential shifts in the market narrative. While BTC has shown resilience, altcoins are becoming increasingly competitive, setting the stage for a dynamic interplay between the two in the coming months. This breakdown in dominance marks a key phase in the crypto market’s evolution, offering opportunities for crypto investors.
Investors should closely monitor the dominance between Bitcoin and altcoins, especially as the 600-day consolidation phase concludes, providing opportunities to adapt strategies and seize emerging trends in this evolving crypto narrative.
We help crypto investors with our crypto research alerts, in which we tipped AI tokens (restricted area content) very recently but also a Big Data token (restricted area content).


