The price of Bitcoin (BTC) is down roughly 14% since August 25th, 2024. Today, BTC continued its trend lower in overnight trading. How concerning is this Bitcoin (BTC) price drop? With the ongoing BTC price drop, concerns of another crypto crash are rising.
RELATED – 15 Cryptocurrency Forecasts For 2025
Many are concerned about the ongoing BTC price drop.
We are not – because we saw it coming – interestingly, we documented that a BTC price drop would occur in the seasonally weak period Sept/Oct even on our public blog in our BTC price drop prediction.
For instance, on July 26th, we released this article – Bitcoin Price Analysis For August 2024: BTC at ATH or Is A Buy The Dip Opportunity Underway?. In it, we said:
The most likely outcome, looking at the above chart, is that BTC will come down to the ‘buy the dip area’ (check our annotations on the chart).
So far, InvestingHaven’s BTC price drop predictions for 2024 are proven to be very accurate.
Question: with a broad market sell-off looming, as per today’s news, is Bitcoin’s price drop concerning or not?
BTC price drop prediction
In our Bitcoin (BTC) price prediction page, a resource full of valuable Bitcoin price insights, we dedicate one specific section to forecasting BTC price drop levels. This is what we wrote several months ago:
A drop in Bitcoin’s price, during the seasonally weak period Sept/Oct 2024, would be healthy provided key levels will be respected:
- A Bitcoin price drop will be ‘bullish‘ provided the 61.8% Fibonacci level of $41,979 will be respected
- A Bitcoin price drop will be ‘super bullish‘ if the 75% Fibonacci level $50,882 will act as a support.
This overview, from the same BTC prediction page, should be top of mind of Bitcoin investors and enthusiast:
| BTC price drop | Outcome | Predicted probability |
|---|---|---|
| $110,000 | Very bullish | High |
| $108,000 | Bullish | High |
| $75,000 | 50% - Bullish | Medium |
| $55,000 | Bearish | Low |
| $40,000 | Extremely bearish | Very low |
The ongoing BTC price drop
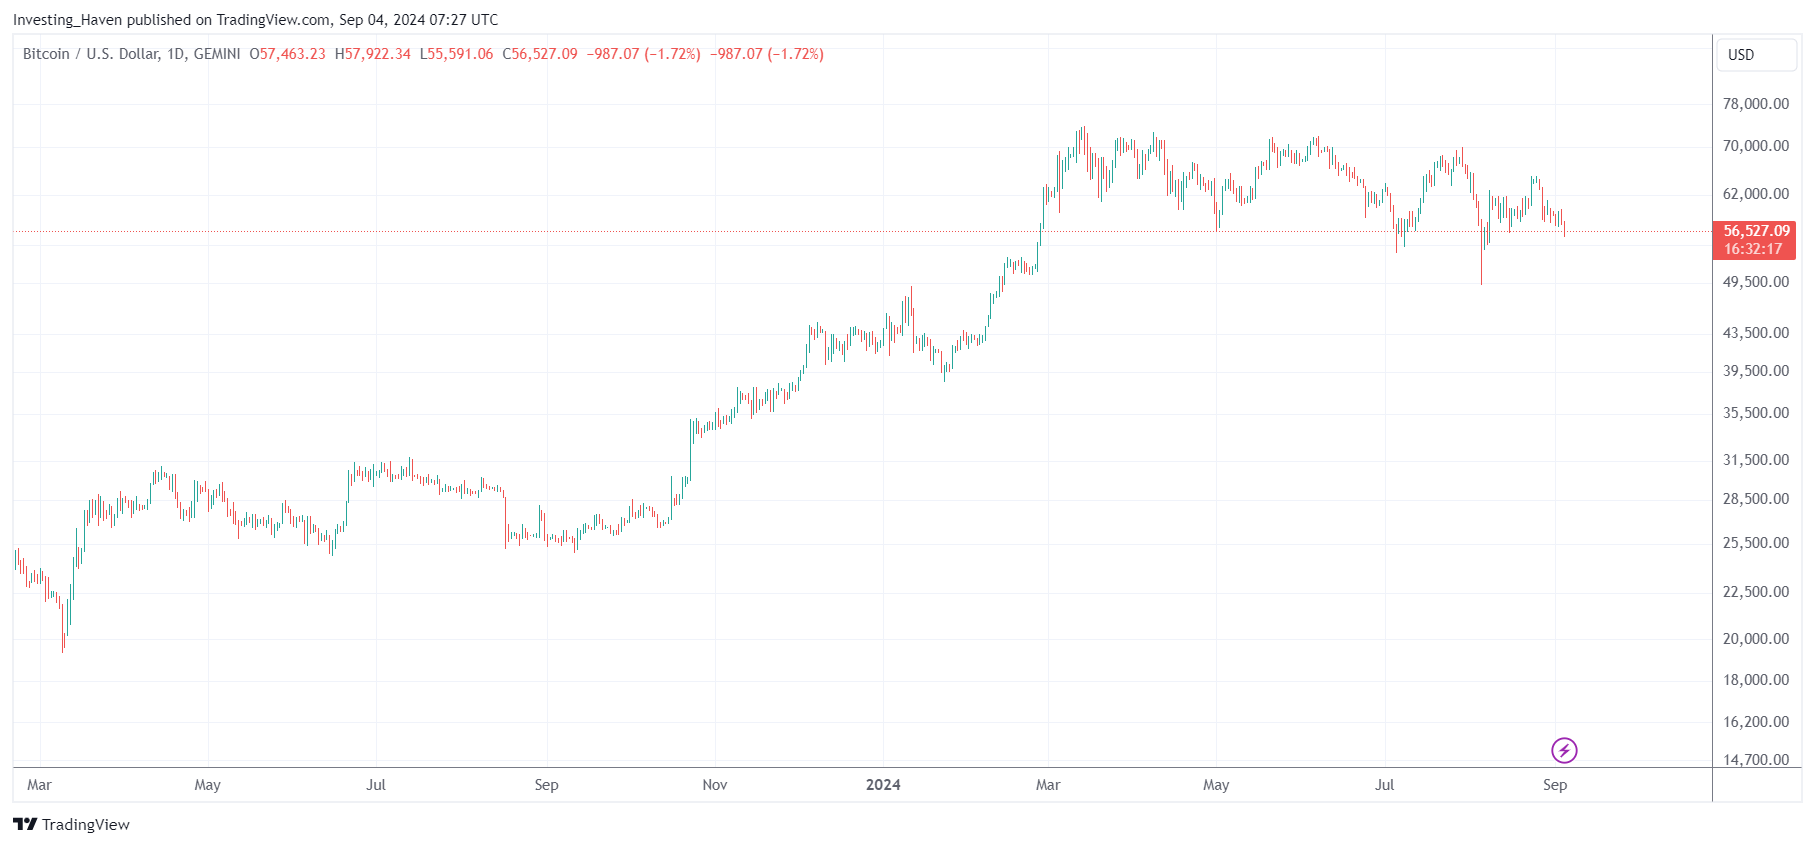
Let’s visualize the ongoing BTC price drop.
We use a BTC chart without annotations.
This is what we observe ‘with the naked eye’ (read: without chart annotations):
- A consolidation in a pretty narrow range between $55k and $69k.
- Support levels are respected which give the consolidation a bullish look right now.
- The importance of the $51-55k area.
At this point in time, no damage done. But the chart is weakening.
The $51k is so crucial, and any BTC price drop should be assessed against $51k.
That’s the one and only conclusion that matters. The rest is noise.
BTC price drop vs. 200 dma
The 200 day moving average (200 dma) should not be used to make predictions.
It should only be used to assess ongoing trends… or price drops.
The BTC price drop against the 200 dma gives one additional insight to investors and BTC enthusiasts:
Bitcoin’s 200 dma is acting as resistance. This implies that Bitcoin needs to build a solid base below its 200 dma before it can stage its next bull run.
The importance of the $51k level is emphasized even more when looking at the BTC chart with its 200 dma.
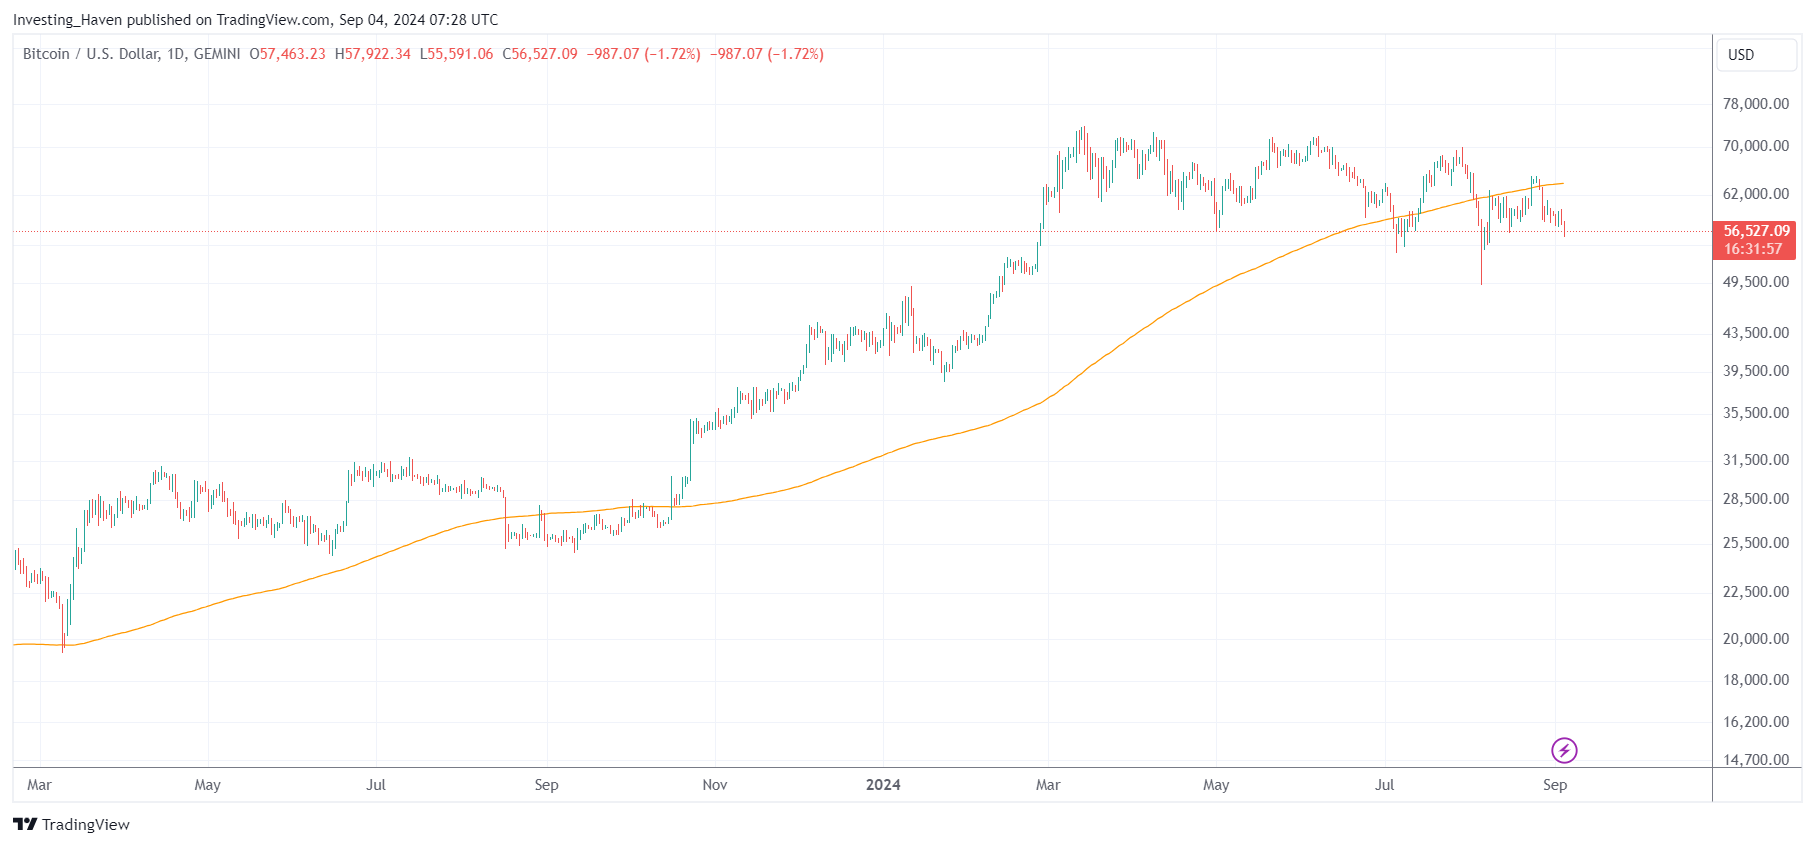
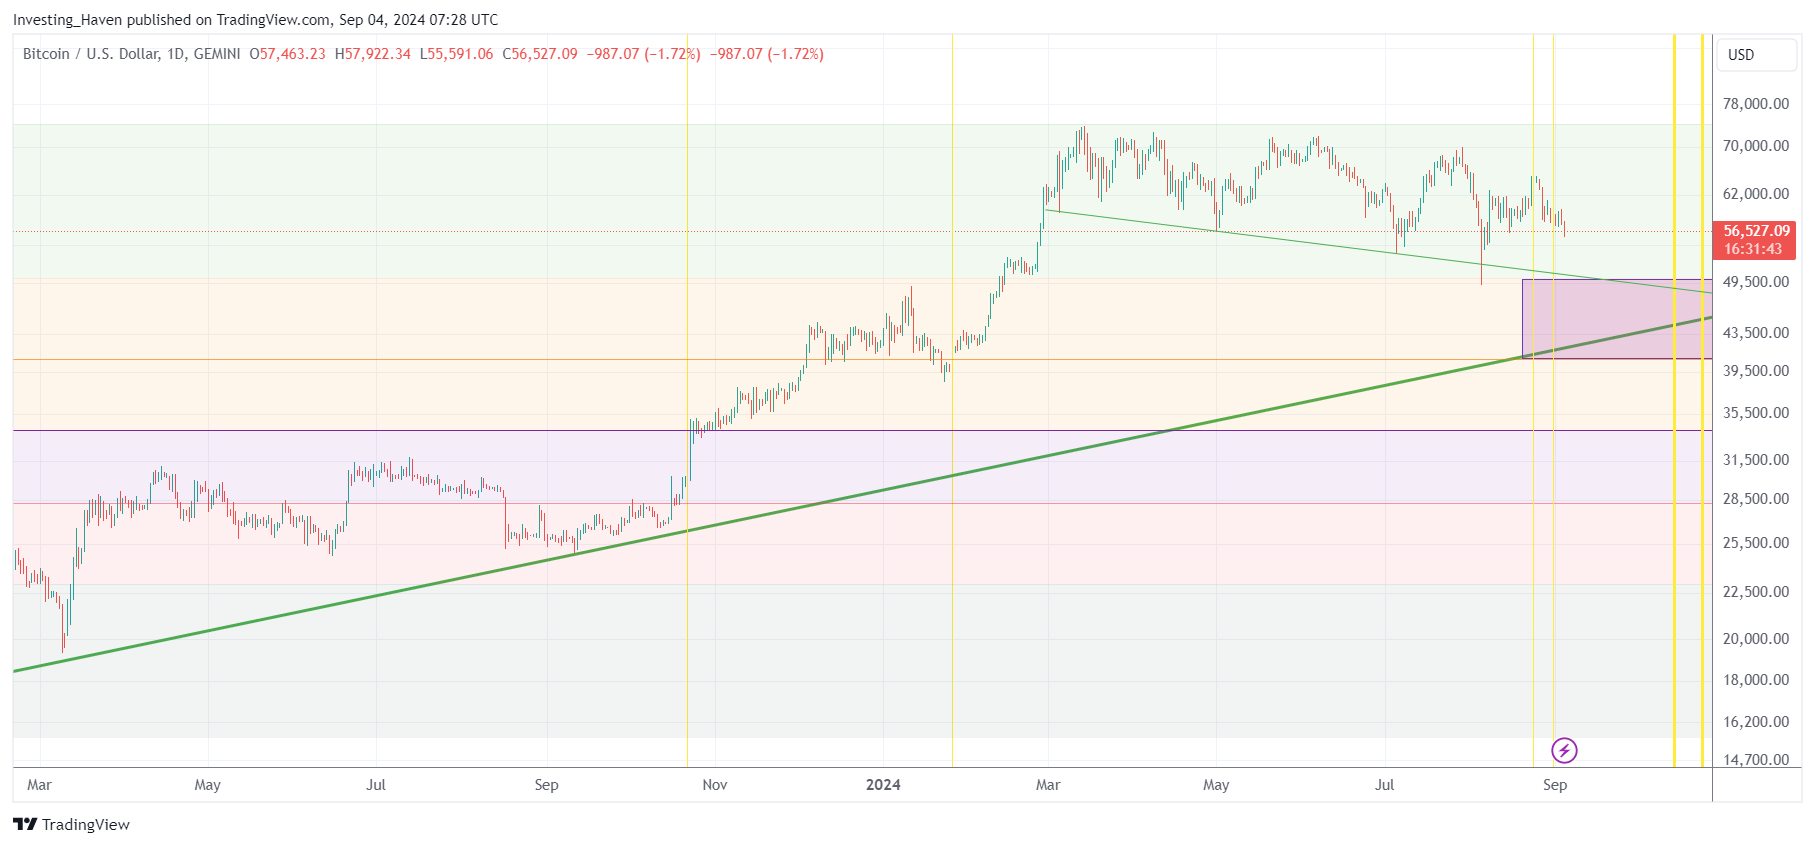
Chart annotations give context to BTC price drop
Last but not least, we turn our chart annotations on.
How different is this BTC chart?
Very different, as all points made above, can be easily recognized through visualization:
- The importance of $51k.
- The probability of $51k to be hit again.
- Why $51k is such a bullish BTC price drop level.
Again, a drop to $51k is not concerning, at all in fact! But this level has to hold for a very bullish 2025; that’s the take-away.
BTC price drop – conclusions
The price of BTC is dropping.
It is unlikely that BTC will stage bullish momentum in the short term – we discussed this extensively on our public blog since many months.
What truly matters are the price drop levels.
What does not matter are message of hope, not based on the chart, like this post on X:
US liquidity just jumped. This might be bottom. $btc 55K
Stay away from the news, it is a lagging indicator.
Stay focused on the chart, is our recommendation.
The BTC chart structure is the one thing that matters!
Consequently, the level that will hold once BTC start turning bullish is the one and only thing that matters. It might take many more weeks, up to a few months, until the market confirms the exact answer to that that question.
In the meantime, we share weekly premium updates for crypto enthusiasts who are looking to capitalize on charts like the ones shown in this article. You too can join us, get instant access to our recent crypto alerts.

