
Bitcoin’s recent price action is indicating that elevated volatility levels are here to stay. Best practice learns that higher volatility requires a higher chart timeframe. That’s why this Bitcoin price analysis is focused on the weekly BTC chart on which one insight really stands out.
READ – Our Bitcoin price prediction.
In this article, we start with a few common mistakes that BTC investors tend to make. This is crucial information to avoid if you want to engage in decent BTC price analysis.
[Trap] Bitcoin price analysis on lower timeframes
The one mistake that investors tend to make is this one:
When markets get volatile, investors tend to move to lower timeframes. They should be zooming out, instead, in order to understand potential damage and impact on the most dominant patterns.
This mistake that most investors make is going with their instinctive reaction.
While it is great to be in synch with your instincts, as a human, it’s wrong in financial markets.
This also explains the highly asymmetric nature of financial markets:
- A small minority of investors is wildly successful.
- A small group is somehow successful over a long period of time.
- Most are not successful even on a long time period.
The above mentioned trap is the most important reason why we continue to be very careful with cash tags on X, e.g. the one of $BTC. Being very selective is important, staying is safest.
[Mistake] BTC price analysis missing dominant patterns
Even if you get it right, avoiding the trap mentioned above, there is another common mistake that most investors will make: zooming out to higher timeframes but missing dominant patterns.
Take this post for instance – while the timeframe is right, the dominant patterns are missing:
Nothing has changed for the long-term #Bitcoin pic.twitter.com/AaV3U7FGVn
— Elja August 9, 2024
Again, be careful, it is crucial to get patterns right on the higher timeframes.
Be selective with the information inputs!
The other common mistake is of course looking for the question WHY did prices drop. After checking the WHY question, applying it Bitcoin’s recent price drop, you find this type of Bitcoin news that is absolutely meaningless. Again, as investor you have to be careful with the news.
[Charting] Dominant patterns on Bitcoin’s price chart
InvestingHaven’s research team tracks 7 distinct BTC charts, each one exhibiting very different patterns and dynamics.
If you want to truly understand Bitcoin, by having the right views in place for high level and low level BTC price analysis, you need to understand all dominant patterns on all timeframes.
Members of our crypto research service get the right BTC chart served at the right moment in time.
That said, if we look at one of the 7 BTC charts that truly matter, the one shown below, we see that a multi-year trendline was touched on August 5th, 2024, the day of the wild and sudden drop in crypto markets.
What’s equally important, is not just that this long term trendline did hold, but also that key support comes in slightly below it: the orange shaded area is an absolutely crucial area.
Why? Because BTC can create a cup and handle pattern if it drops to that area. The one important pre-requisite: it should recover within a period of 3, 5, 8 weeks. In doing so, it would do something similar as in Dec of 2022: invalidate a breakdown below its multi-year rising trendline.
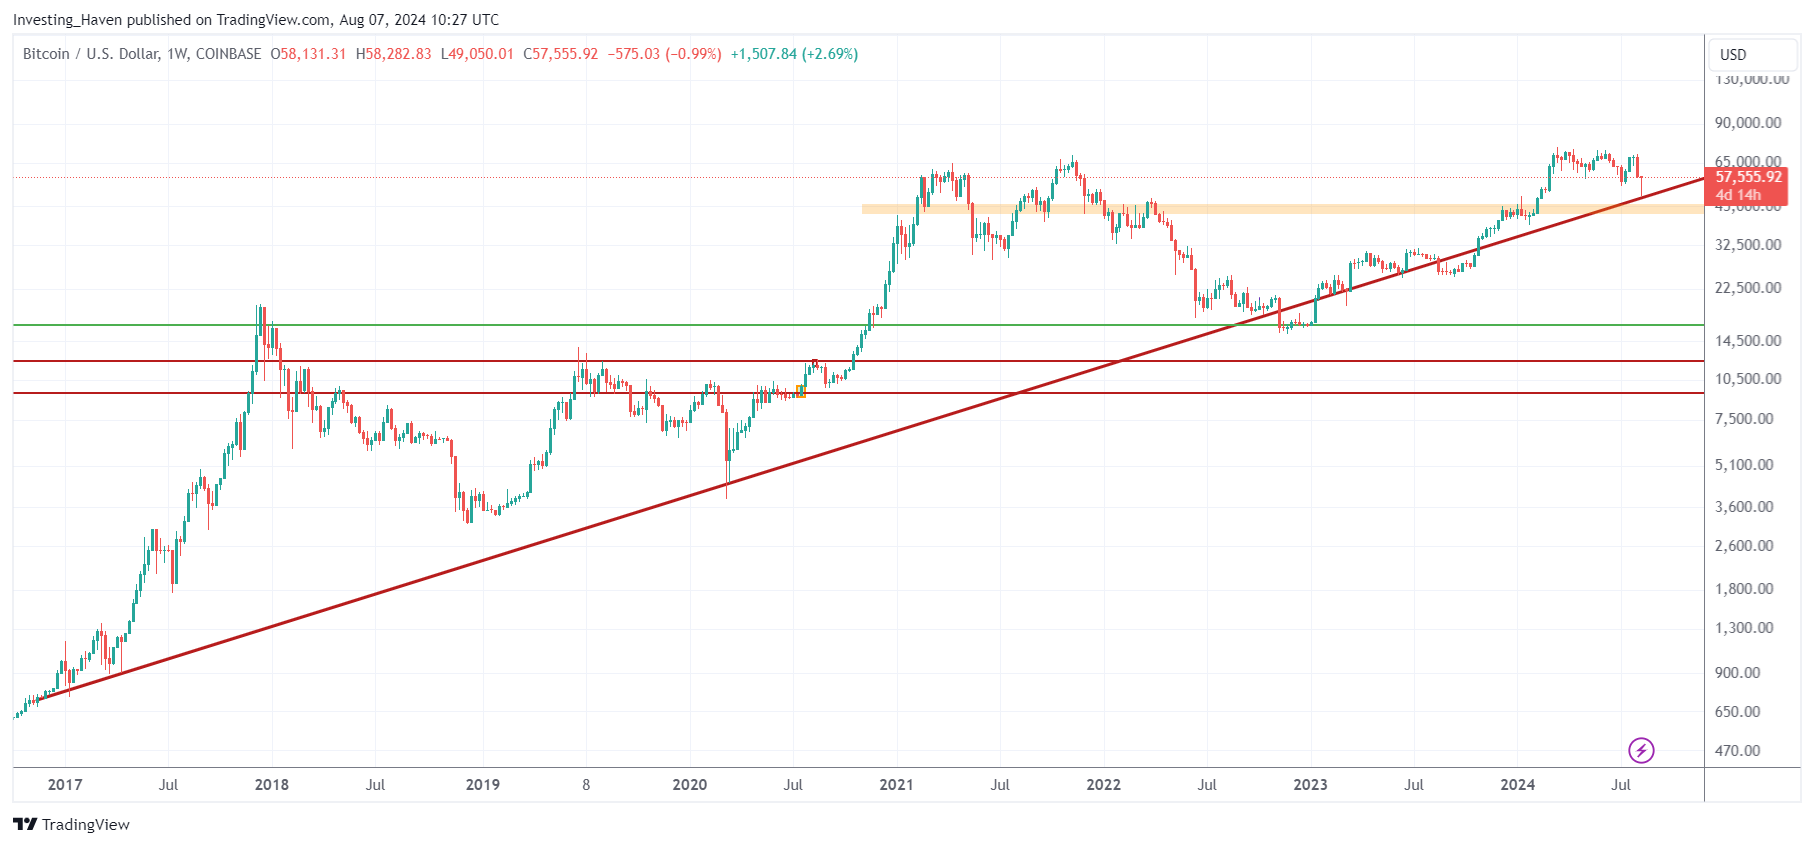
The above chart marks THE most important dominant pattern for Bitcoin.
It is a shame if analysts miss this type of crucial and fundamental information.
Anyone who pretends doing a Bitcoin price analysis, not showing these dominant patterns, is a pseudo-analyst.
NOTE – Crypto investors might be interested in the following 2 premium research alerts:
- Warning: Dominant Dynamics In Crypto Markets. Also, Prepare For Buy The Dip Opportunities In These Tokens. (Aug 1st, 2024)
- The Next Big Wave in Crypto Markets (July 23d, 2024)
While it is too early to re-enter the crypto market with new positions, it certainly is possible to see what the next big narrative might be by reading the editions highlighted above (log in required which will grant instant access).

