
BTC from resistance to support, that’s how August 2024 will likely play out. BTC won’t exceed $70k on a 3 to 5 day closing basis while $61k and $52k are obvious support targets.
RELATED – Will BTC hit $100,000?
In this blog post, we look at the most likely short term outcome for Bitcoin (BTC).
Insights in this article are based on our BTC price predictions; we compiled important and relevant insights that come out of our continuous Bitcoin research. We identify insights and present them in a way that is helpful to readers (as opposed to 99% of crypto related content on the web that is not useful whatsoever).
Note – our summer 2024 readings in blue chip tokens have been proven highly accurate so far (forecasted period: June & July 2024).
Bitcoin price analysis: pitfalls with short term focus
The problem with short term price analysis is that you may fall in the trap of ‘forgetting’ the bigger picture.
There are a lot of things that can happen in this mental process when looking at the short term timeframes:
- Bias – the investor desires and hopes for an outcome, suddenly all data points point to the desired outcome.
- Missing dominant patterns – if the timeframe is short term, not initiated on the higher timeframes, the dominant patterns and trendlines will be missing.
- Pseudo analysts – the short term timeframe is so easy to sketch out, nowadays ‘everyone’ is a price analyst, taking the work of pseudo analysts too serious is damaging (simple as that).
Stated differently, be very careful whenever you see the term ‘short term price analysis’.
The short term has many pitfalls.
This is an illustration of such a pitfall. This one past is full of red flags, be careful with this type of analysis.
$BTC 1 hr
all I see is bullish flag after bullish flag after bullish flag, LFG 🚀 pic.twitter.com/Ix6Zd6y0yW
Here is why, and readers should spot the easy-to-find differences:
I try to be as honest as possible to Edwards/Magee/Schabacker in pattern labeling. The current congestion in Bitcoin is NOT a flag (it has lasted too long) but appears as a down channel. $BTC pic.twitter.com/OJcpML6VPT
— Peter Brandt (@PeterLBrandt) July 20, 2024
Bitcoin price analysis: short and medium term view
Although we will focus on the short term readings, i.e. BTC in August 2024, we must start with the higher timeframe.
RELATED – Will Bitcoin ever hit $1 million?
The big picture findings on our BTC price chart:
- The long term rising trendline is dominant; ignore this at your own peril.
- The support levels are clear – $61.9k followed by $51k (arguably, it is an area $49-51k).
- The pattern shaping up in the area $61.9k to $71.9k seems much more of a topping pattern, more than a basing pattern or continuation pattern.
This is the daily BTC chart from which we can derive August 2024 outcomes.
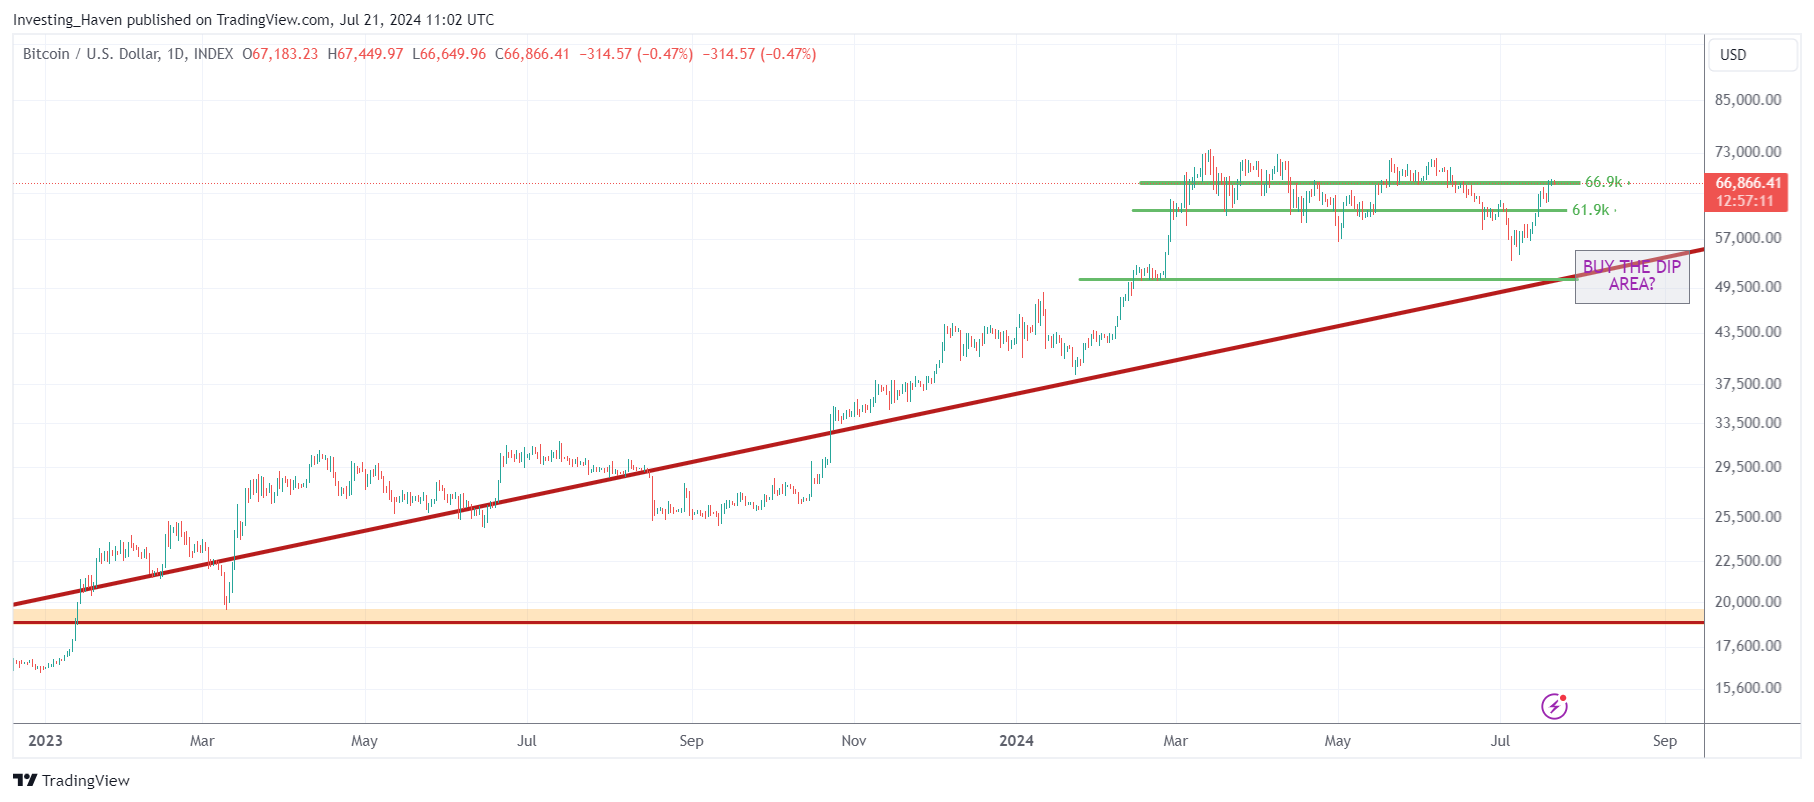
BTC in August of 2024
The most likely outcome, looking at the above chart, is that BTC will come down to the ‘buy the dip area’ (our annotation on this chart).
There are several reasons why we think so:
- According to timeline analysis, August is a period with a ‘volatile’ character. The most likely outcome is for volatility to pick up, we would give this outcome an 80% probability.
- Any solid foundation requires a triple bottom. So far, BTC has printed a double bottom in the $55-57k area.
- The long term rising trendline should provide really strong support to confirm a support area.
With all this mind, we favor a drop in the price of BTC in August 2024. Not a crash, to be clear, but a regular pullback. If the ‘buy the dip’ area on our chart holds (a pre-requisite), it will be a long term ‘buy the dip’ opportunity.
In our premium crypto research alerts, we share specific dates (which we never share in public blog posts) and hunt for the next narrative (sniffing for potential multi-baggers). You can access all our recent crypto alerts here >>

