
In case Bitcoin decides to move lower in the coming months, which is a high probability outcome, it must hold $41,000 on an 8-day closing basis in order to qualify as a bullish pattern with a bullish outcome.
It is clear by now – Bitcoin is struggling, and it is likely going to continue to struggle before it can develop a new uptrend.
There is nothing wrong with a ‘cooling off’ period after a 4x rise in a period of 18 months.
RESTRICTED AREA – Where and When Could Bitcoin Bottom with Price & Timing Targets
Bitcoin’s supply/demand situation does not look good right now. It’s shaky. Uncertain.
TODAY: German Government selling up to 2700 BTC ($154.60M)
In the past hour, the German Government has sent 2700 BTC ($154.60M) to Kraken, Bitstamp, Coinbase, 139Po (likely institutional deposit/OTC service) and address bc1qu.
Since yesterday’s movements, the German Government… pic.twitter.com/XNyqgzPR7M
— Arkham July 12, 2024
Whenever a specific market feels uncertain, it is imperative to zoom out.
This is what happens when looking at Bitcoin’s big picture.
Hint: it’s interesting, also bullish!
Bitcoin’s long term trend is up
Bitcoin’s long term chart is the one we need in order to understand trends, patterns but also critical levels.
If anything, what stands out is the long term moving average (90-week) is rising. That’s a good thing!
Moreover, the double top pattern (W structure) on Bitcoin’s chart, printed since March of 2024, is a very soft version of the one printed in 2021. That’s also a good thing – it suggests that the subsequent drop won’t be that steep.
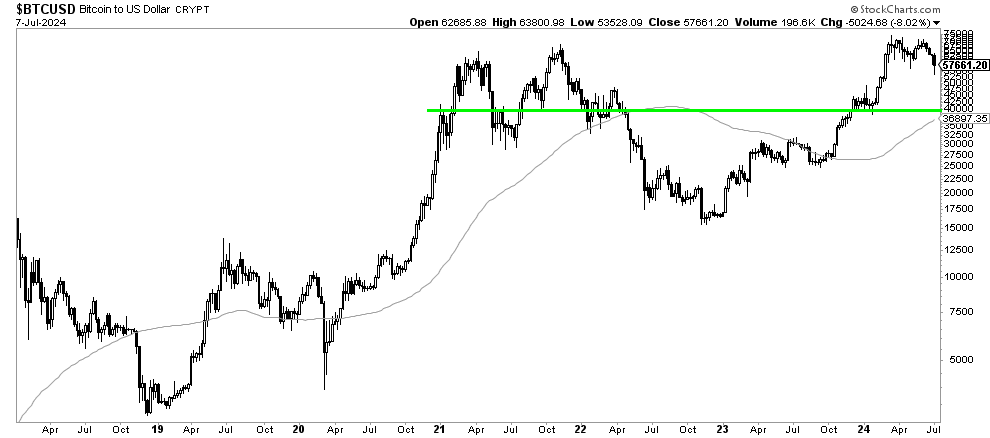
Bitcoin: ‘maximum pain’ level
Other than the rising trend, and soft double top pattern, we also want to derive the ‘maximum pain’ level that Bitcoin’s secular uptrend can handle.
This ‘maximum pain’ level really is the lowest level that Bitcoin can drop to in order to remain bullish long term.
We believe the ‘maximum pain’ level is $41,000. Here is the rule of thumb that applies to this level:
- Bitcoin may drop (not for sure) to this level.
- Even if BTC moves lower, it may do so temporarily, in a capitulation selling period.
- The rule of thumb is that BTC should recover, even if it drops below $41,000, on a 3 / 5 / 8 / 13 day basis (daily candles touching $41k).
We are not predicting that Bitcoin (BTC) will for sure move to $41,000.
We are saying that, even IF Bitcoin would drop that low, it will still qualify as a bullish long term setup with a bullish outcome.
RELATED – Bitcoin price drop predictions
Frankly, we believe that the $41-$44k area will be the area where capitulation selling will occur in the period Aug-Oct, somewhere, at ‘a’ certain point.
Bitcoin’s 3-week trending periods
Bitcoin typically does not move in strong trends.
Whenever Bitcoin starts a strong trend, either up or down, it tends to be a move in a concentrated period of time. Typically, strong moves occur in a 3-week period.
In case Bitcoin would drop below $51k, with is a real possibility in the time period Aug-Oct 2024, it will likely accelerate selling in a 3-week time period.
So, it is wise to be patient and wait until a storm hits. In case it’s not hitting, great, Bitcoin’s downside might be $49-51k. However, in case there is more downside, then selling will occur in a 3-week period, pushing to the $41-44k area.
Stated differently, no need to feel FOMO in the coming 3 months!
Sign up to our premium crypto research alerts to hit multi-baggers in 2025. You can also benefit from our 10-year anniversary offer, combing our premium crypto and gold/silver research.

