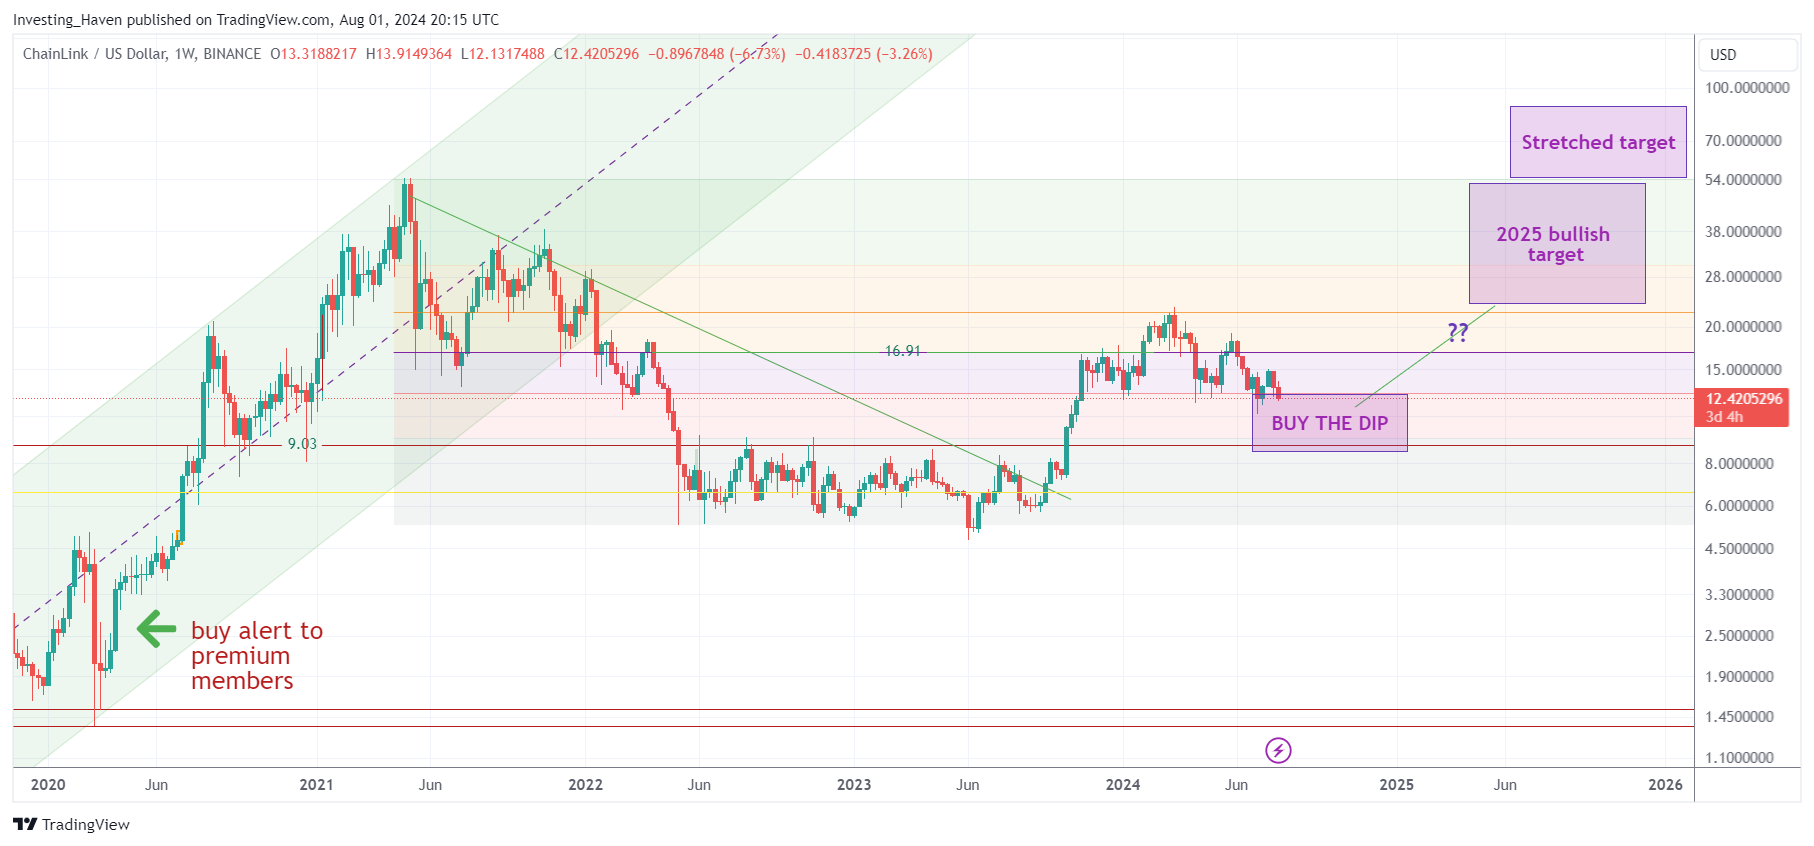
The Chainlink (LINK) chart suggests that investors should be cautious, but start preparing for buy the dip opportunities in Q3 & Q4 2024.
SOURCE – Chainlink (LINK) price prediction research.
In relative terms, the recent LINK price drop was soft. Many other altcoins sold off heavily.
However, Chainlink’s relative price weakness since early 2024 is raising the question whether and when it will recover.
Chainlink price retracement: 2024 not great for LINK
The price of Chainlink (LINK) experienced a major rise in the period October 2023 – March 2024.
In that same period, LINK went from $6 to $18, a move we expected and communicated to premium crypto members well before it started.
Since then, however, LINK retraced and it wasn’t able to move higher. In relative terms, it only retraced some 40% from its peak. Compared to some other cryptocurrencies, who lost up to 80-90% of their value, it’s relatively good. Still not a great year for LINK enthusiasts.
The question comes up why Chainlink, with such a great foundation and fundamental value, isn’t able to see price appreciation in its token?
RELATED – Can Chainlink (LINK) Ever Hit $100?
Two answers come to mind:
- Long term, LINK is up a lot. Long term LINK holders have enjoyed the ride. This makes the point that successful and profitable crypto investing requires a long term time horizon and long term oriented strategy.
- Crypto markets are dominated by narratives.
The only question that matters, going forward, which narrative will include LINK to see its token price appreciate to new ATH? The answer to this question is unknown at this point in time.
Chainlink price retracement: the long term chart
If anything, the long term LINK chart does not look bad.
The pattern we see: a long term cup and handle reversal. This is a bullish pattern provided $8.88 will be respected as a support area.
The weekly Chainlink (LINKUSD) price chart with our annotations as featured on our Chainlink predictions research page (link in the intro of this article) is shown below.
We recommend LINK investors to focus on the Fibonacci levels on the long term chart, first and foremost the 50% Fibonacci level ($17) and the 38.2% as well as 61.8% levels.

To LINK or not to LINK
There is a very simple answer to the question whether LINK will offer a buy the dip opportunity.
If the ‘buy the dip’ area, annotated on our chart above, is respected, by end of October 2024, it will be a buy the dip opportunity. In that scenario, the current drop is not concerning in the bigger scheme of things.
While we like LINK a lot, we also believe a diversified crypto portfolio requires a few holdings, not just one.
The underlying reason for this viewpoint: intensifying bi-furcation in crypto markets.
Most altcoins will underperform in the coming crypto bull cycle which will be a bi-furcated cycle. A minority of tokens will go up 10x or more.
Which ones will outperform?
That’s exactly what we wrote about in recent weeks. We believe we see a very clear trend, and we see it clearly.
- Warning: Dominant Dynamics In Crypto Markets. Also, Prepare For Buy The Dip Opportunities In These Tokens. (Aug 1st, 2024)
- The Next Big Wave + Two Solana Token Tips (July 23d, 2024)
While it is too early to re-enter the crypto market with new positions, it certainly is possible to see what the next big narrative might be.


