The price of Ethereum (ETH) touched $2,318 in overnight trading on September 4th, 2024. In the last 10 days, ETH is down nearly 19%, top to bottom. How concerning this? Is there much more downside in the price of ETH?
READ – A bullish Ethereum price prediction 2025
A broad market sell-off is looming:
- Nvidia is down 9% on a single day.
- Consequently, the price of Bitcoin dropped evoking fears of a crash in crypto markets.
- The US Dollar is up 2% in recent days.
Ethereum will not escape broad market weakness.
Question: is ETH able to hold up in a weak environment?
Ethereum price drop – ETH chart weak
On August 2nd, 2024, when ETH was trading well above $3,000, InvestingHaven predicted that ETH would drop in the period August – September 2024.
A volatility window was underway is what timeline analysis suggested.
READ – Ethereum Price Dropping – Is ETH Headed To Our Predicted $2555 Target? (Aug 2nd, 2024)
In our ETH price prediction research, we predicted the following price drop levels:
| ETH price drop | Fibonacci | Outcome | Prediction |
|---|---|---|---|
| $4,109 | 25% | Bullish | High probability |
| $3,525.69 | 38.2% | Bullish | High probability |
| $2,746.13 | 50% | Bullish | Medium probability |
| $2,430.11 | 61.8% | Bearish | Low probability |
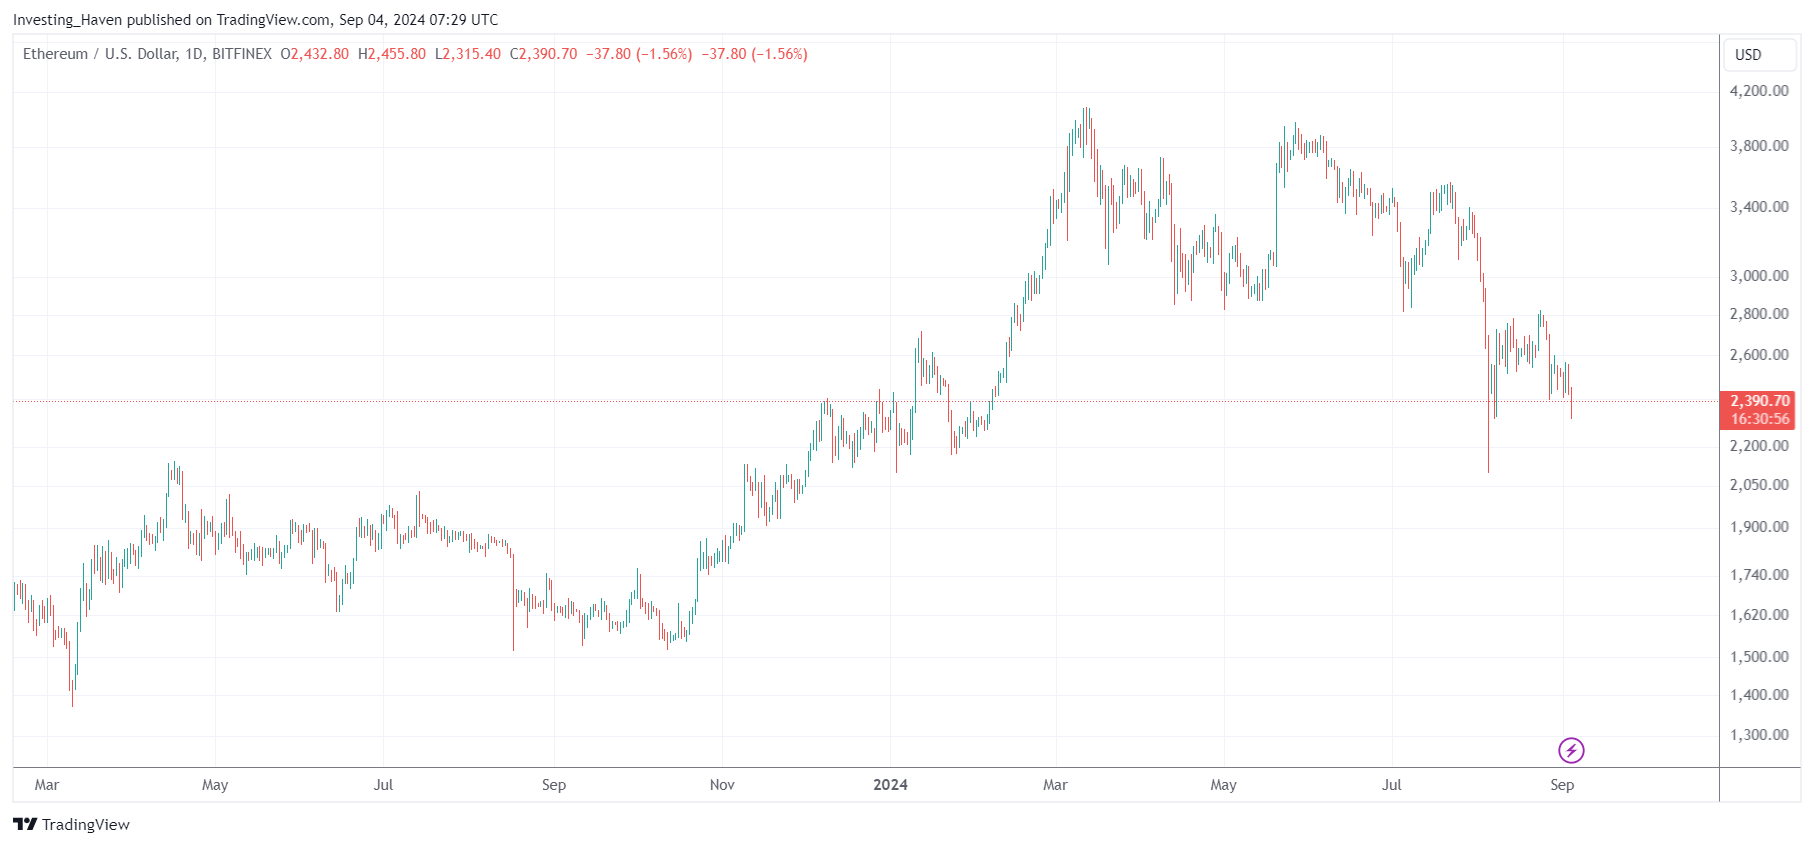
Fast forward to today.
If anything, the ETH price chart does not look very constructive.
On the flipside, ETH is respecting support in the $2,200 area.
Ethereum price drop – A very important trendline test
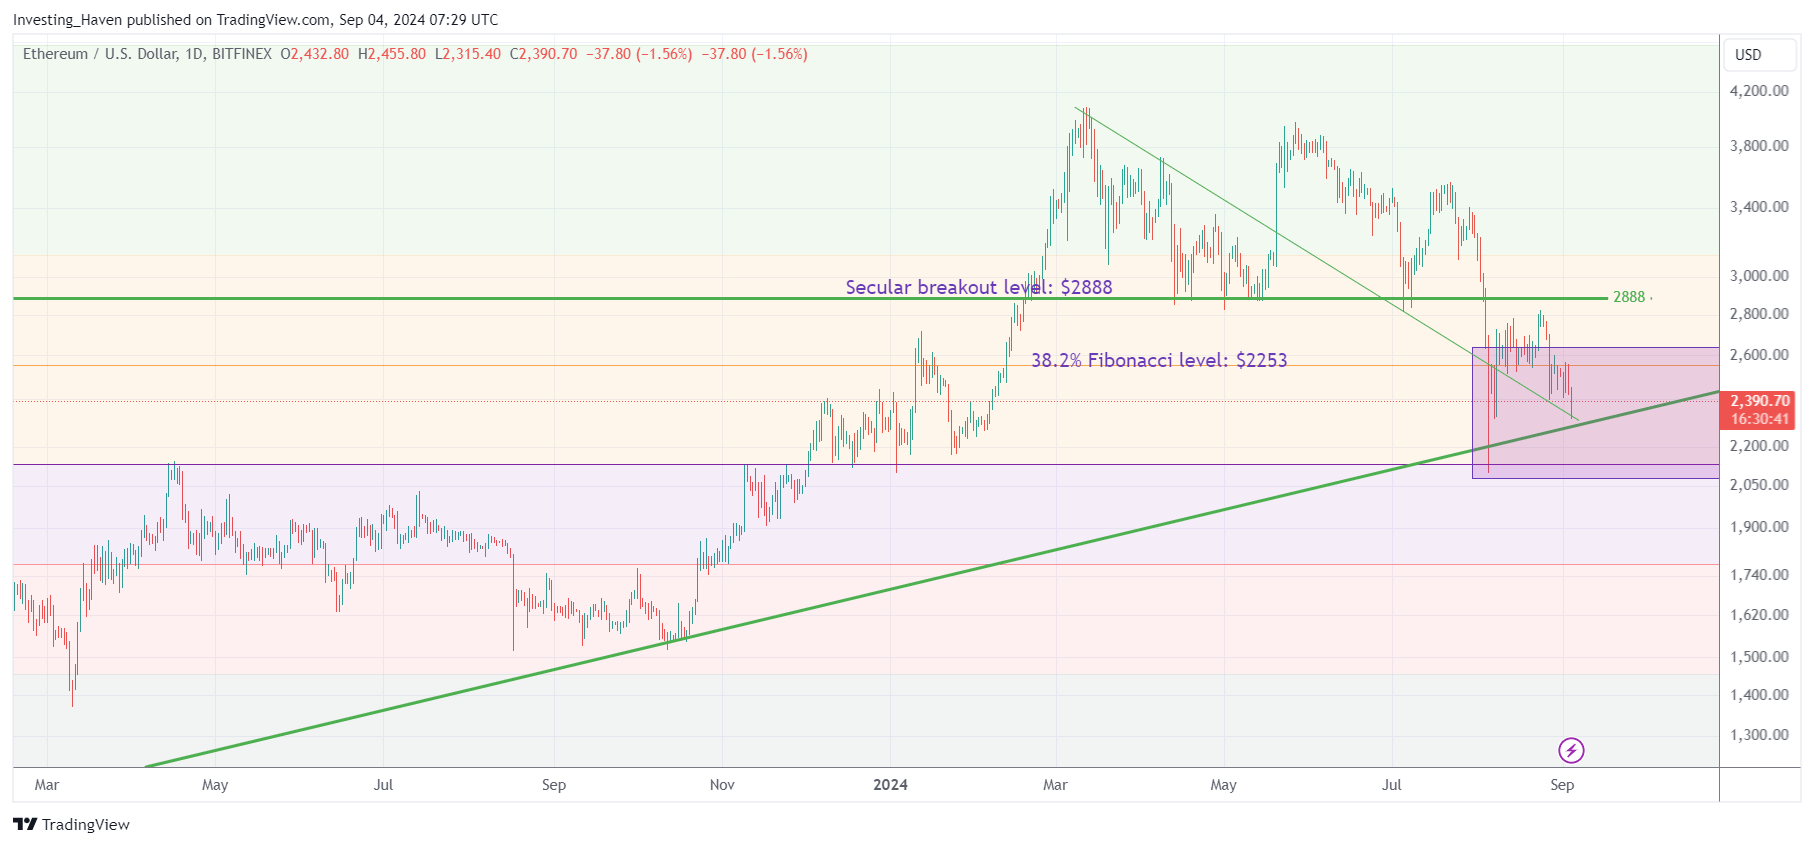
Below chart shows what happens when we turn on our chart annotations.
Suddenly, there is context and clarity:
- A long term rising trendline might come to the rescue.
- ETH dropped to the very important 50% Fibonacci retracement level.
- This implies double support for the price of ETH.
While the news might be predominantly bearish, the support structure on the chart of ETH paints a very different picture. Only one news item aligns with our view – this ETH post on X got it right.
ETHBTC support
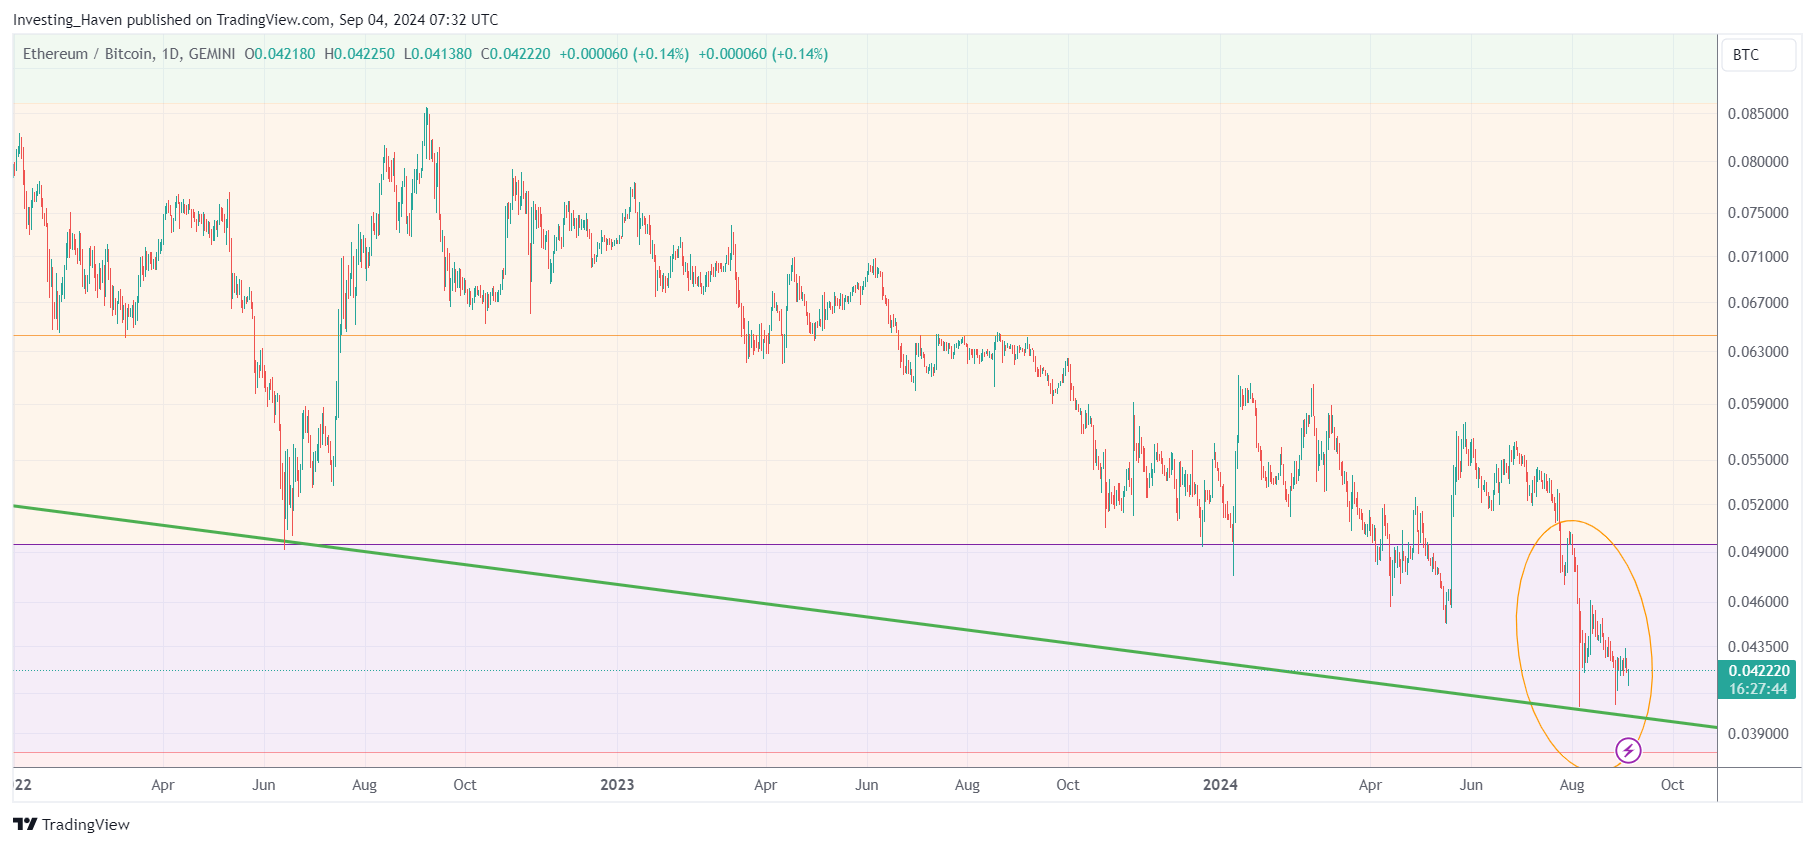
The most encouraging chart is ETHBTC.
We discussed this one extensively in recent weeks and months.
The long term falling trendline should provide support to the price of ETH – the accelerated decline relative to BTC should decelerate now.
On the flipside, ETH cannot create bullish momentum as long as it’s below 0.05 in BTC terms (see chart).
Ethereum price drop – conclusions
A few conclusions from the ongoing price weakness in the price of ETH as well as crypto overall:
- It is expected for ETH and crypto to be weak. We predicted this many months ago. There is a volatility window on the timelines AND Aug/Sept are seasonally weak months.
- ETH is weak relative to BTC but this weakness should turn into flat relative performance.
- ETH is reaching rock solid support levels now.
- Bullish ETH price drop levels are being tested.
In other words, as long as ETH remains above $2,100 roughly, it was price weakness in line with expectations and predictions.
Any further price drop in ETH, well below $2,100, will create a more concerning picture for the 2nd largest cryptocurrency. We believe the probability is low, nevertheless it is a probability.

