In fact, we would argue that there is a very specific price/date combination for ETH to watch. There is a potential harmonic price/time combination coming up: $2,888 on August 28th, 2024. A dip on that day at that price could offer a buy the dip opportunity.
Ethereum investing requires big picture thinking
The problem with the current market environment is the focus on the short term timeframe.
Take, as an example, X. There is an overload of opinions on the cashtag $ETH, and that’s of course because nowadays everyone wants to be a forecaster and loves collecting likes and followers.
The “give me an Ethereum prediction tomorrow” crowd is not profitable.
That’s because crypto investing requires a long term viewpoint.
Big picture analysis is instrument for success. That’s because of the hyper volatile nature of cryptocurrencies.
RELATED – Can ETH ever hit $100,000?
Ethereum’s big picture chart
The big picture chart of Ethereum is a beauty, and it contains so much information.
Needless to say, for the short term oriented crypto crowd this chart is boring because you can’t constantly post it to your followers on social media as short term trade ideas.
That said, let’s pick out the top highlights of this long term ETH chart:
- The long term rising trendline is key, it should not be breached.
- The short term falling trendline is touching the long term rising trendline late summer 2024.
- There are a few horizontal levels that are critical: the reversal level ($2,888) and 2 Fibonacci levels.
That’s it. It’s as simple.
All the rest is noise!
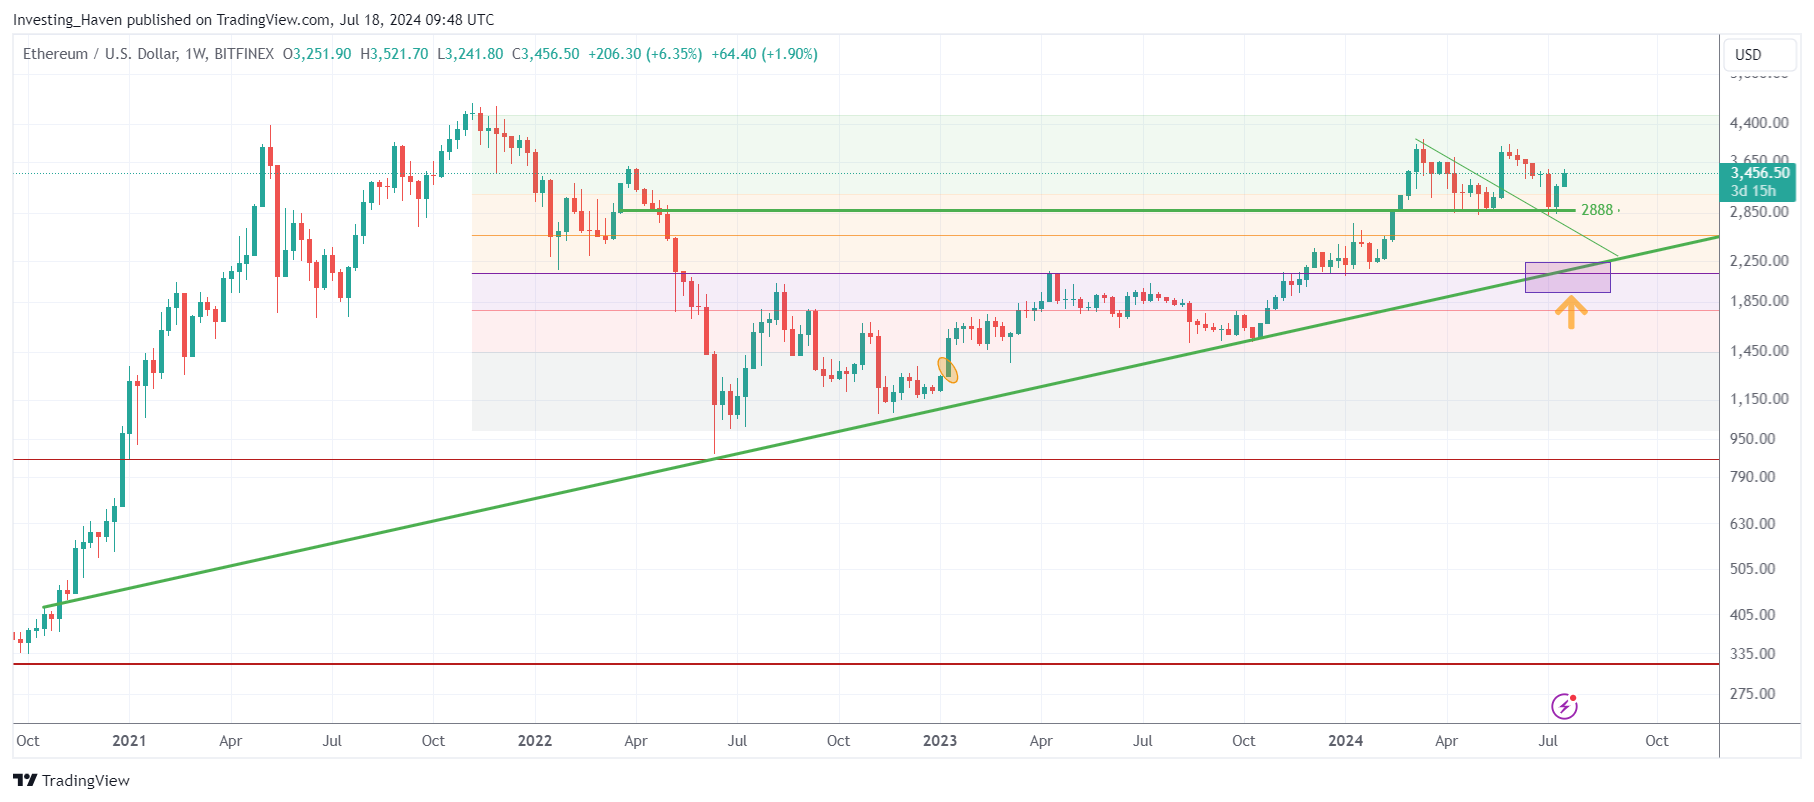
Source – TradingView
Ethereum in August 2024 – the most bullish outcome
While the above long term chart comes with good insights, especially as it relates to long term chart structures, we also want to understand the short term picture.
For August of 2024, there are a few price points to watch. Interestingly, there is also a specific time/price combination to watch.
- The most bullish outcome will occur if ETH will be able to hold $2,888 in August 2024. Preferably, of course that same level holds in Sept and Oct.
- If $2,888 would give up, there is still the 38.2% Fibonacci level at $2,253 that will give a bullish outcome, just not as bullish as if $2,888 would hold.
- Interestingly, in August 2024 there might be a harmonic time/price combination that could be tested: $2,888 on 28.8 (British date format). IF (and that’s a big IF) $2,888 will be tested on 28.8 AND this level holds in the weeks that follow, it might be an epic buy the dip opportunity. All conditions must be respected for this to occur though; it might also play out very differently.
The short term ETH price chart says it all.
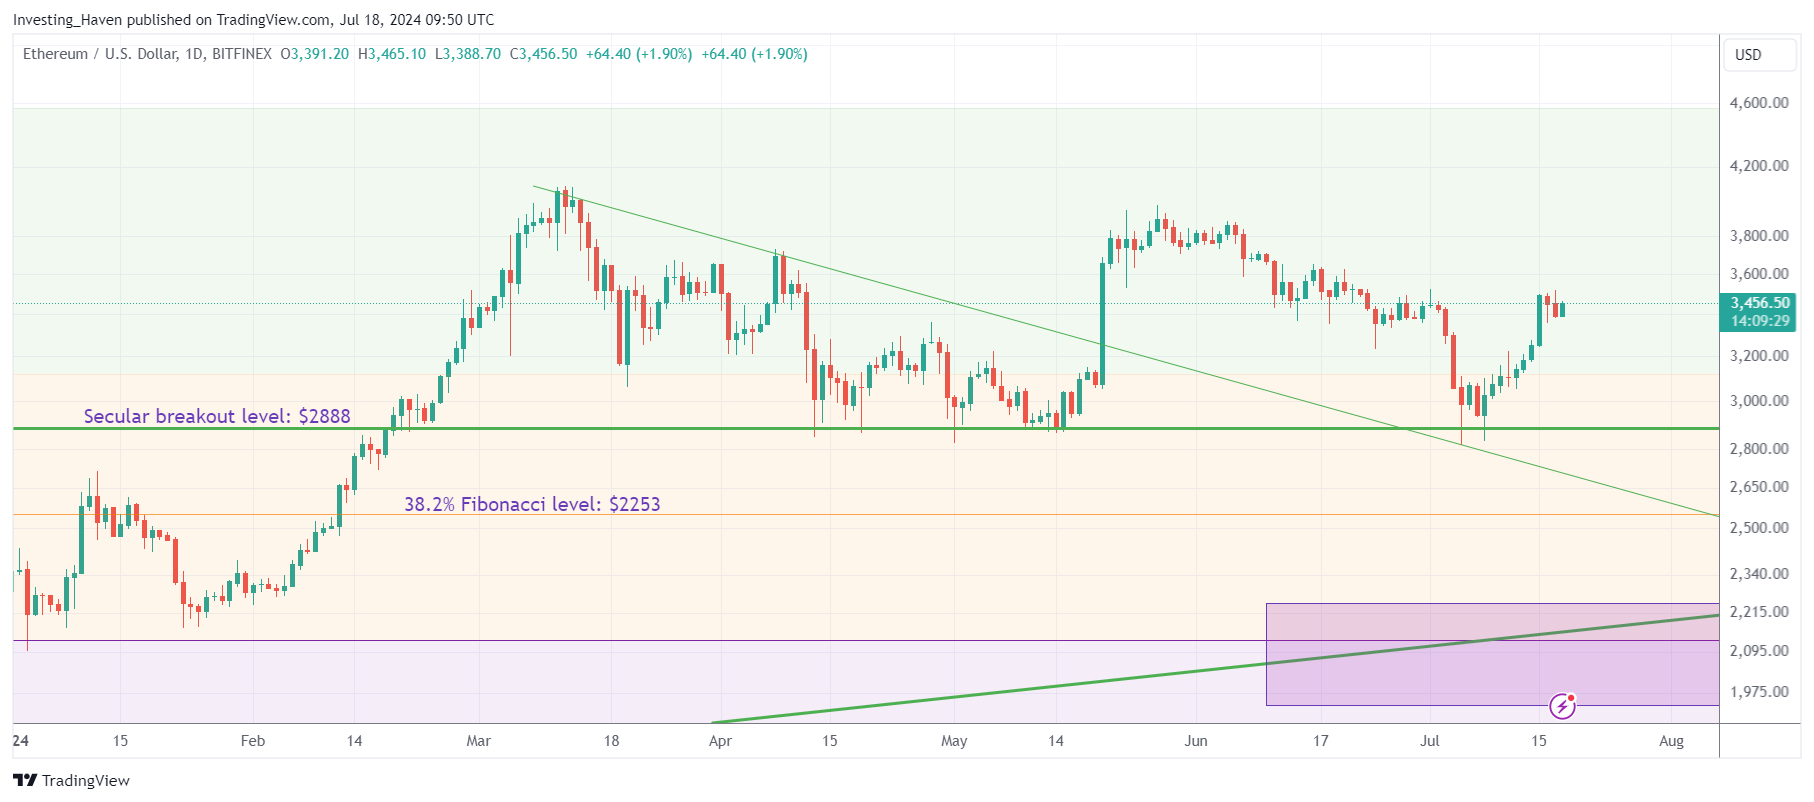
Ethereum in August of 2024
We believe crypto will get more volatile in the month of August, broad markets are likely going to see increased volatility levels as well.
It already started last week, with Nvidia’s sudden drop, followed by more big tech selling the other day.
Crypto is not immune to this. In fact, crypto tends to lead big tech higher and lower, most of the times. It did so in Oct of 2020, in Sept of 2021, in Jan of 2023 and again in Oct of 2023.
We are in the ‘stay defensive’ camp until broad markets will have moved lower, and Bitcoin confirms selling exhaustion and starts showing signs of stabilization (amid volatility in broad markets).
A summary of this blog post appeared on our Linkedin account.
You can follow our premium crypto research alerts to understand when the conditions are in place for a crypto bull market continuation, presumably somewhere in the next 3 months.

