
Now that markets have confirmed the start our predicted volatility window on August 2nd, 2024, prices of crypto will come under pressure the coming weeks.
RELATED – Read InvestingHaven’s Ethereum price prediction.
Isn’t it amazing to observe the divergence between investor expectations and price action?
Ethereum price lower despite ETF hype
At InvestingHaven, we have been forecasting a volatile August, to begin around August 2nd, 2024. Our prediction could not have been more accurate. Our recommendations, based on timeline analysis findings, included:
- July 14th, 2024: “In this edition, we look once again at the 3 downside targets for Bitcoin late summer 2024. Specifically the month of August is expected to be volatile according to our timeline analysis.”
- July 23d, 2024: “We don’t see new ATH in July nor August, certainly not a new bull run above ATH is not for now. We don’t see a bullish reversal pattern on Bitcoin’s daily chart.”
In particular, the hype around ETH ETF approvals created a perception that price would continue to move higher. This is in shrill contrast with ETH price action.
What investors tend to forget is that institutions think and act differently than individuals do.
Take for instance this news item: Ethereum ETF flows flip positive despite Grayscale outflows topping $2B. Feels good? It shouldn’t! Because what you don’t know is how much institutions like Blackrock, buying ETH, are hedging their positions.
ETH price drop – the importance of $2555
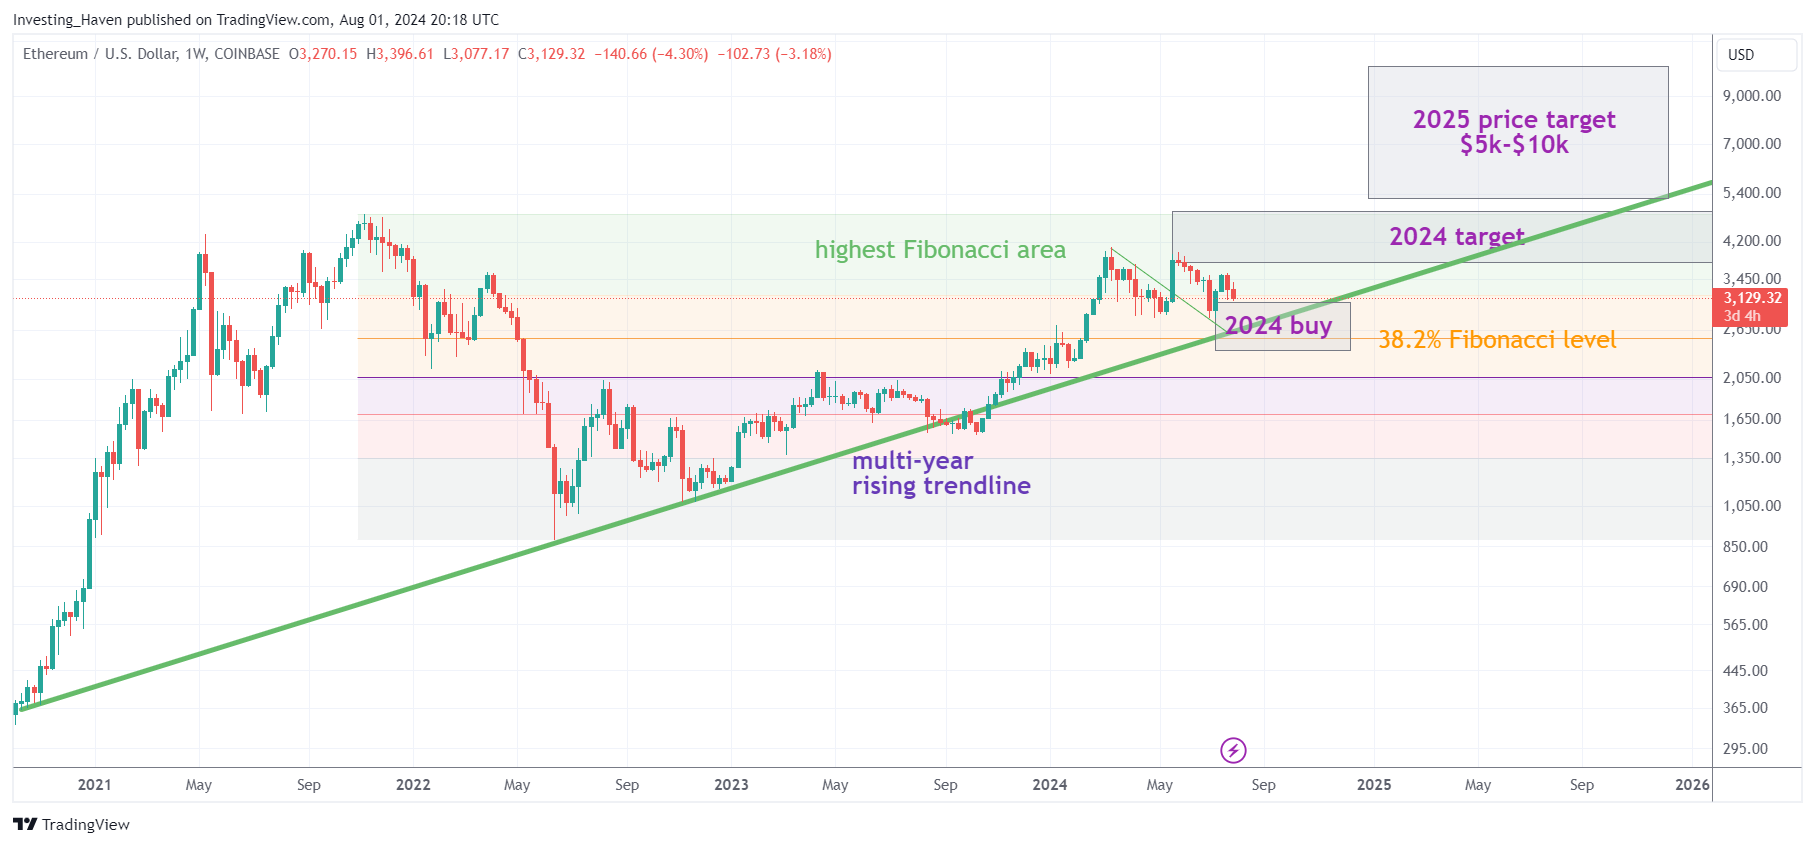
It is pretty clear by now that ETH has to test $2555 in 2024.
That’s where our suggested ‘buy the dip’ area comes in.
However, that’s also where our bullish invalidation scenario kicks in.
In fact, it’s very simple for ETH – the long term rising trendline on Ethereum’s multi-year chart has to hold.
How much more simple can investing be?
Investors better stay away from short term charts. It’s noise. Serious investors need serious research which start by longer term oriented charts which combine both price and time analysis.
ETH price drop – the importance of $2555
If we look at our ETH price drop predictions, we see the following key levels as price drop candidates (read: exhaustion selling levels):
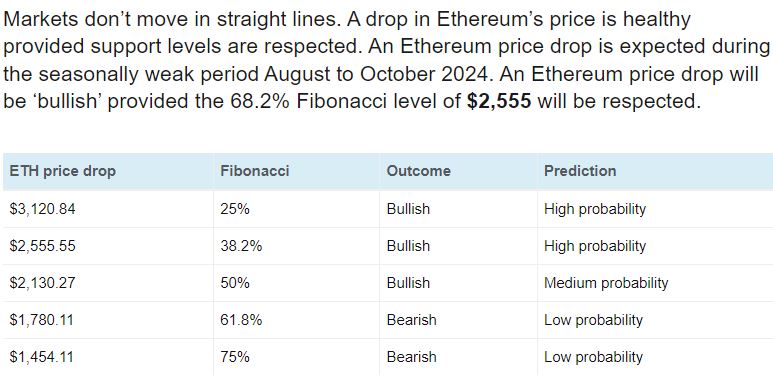
The $2555 level plays a key role. It is one of the really important Fibonacci retracement levels.
The market will shake out bulls and bears at $2555
Watch out – while it is important to understand charts, it is equally important to understand market behavior.
If and when the market will get closer to $2555 in Ethereum, we reasonably expect a lot of volatility right at that level. That’s because bulls and bears realize the importance of this level, both will do their best to be right by betting big right at that price point.
How to avoid being shaken out?
Very simple, investors should not try to rush in, nor should they try to front run the market.
The only way to know for sure whether $2555 will hold is checking what the market does, on a daily closing basis, after 3 days, 5 days, 8 days, 13 days, etc. (the Fibonacci sequence).
So, our warm recommendation is to track price action around $2555, not on an intraday basis, but on a daily closing basis, track in a structured way what type of micro pattern becomes visible on Fibonacci days.
We are doing the tough work for our premium members. You too can track crypto markets in a structured way, particularly how we track both price and time, in a unique way, which gives peace of mind. Receive our premium crypto research service alerts >>

