It certainly is concerning to see the long term decline of ETH priced in BTC. However, there is potentially some good news for ETH investors, here is why.
RELATED – Read our latest Ethereum price prediction.
While the price of Ethereum (ETH) in USD went up early 2024, it didn’t relative to BTC.
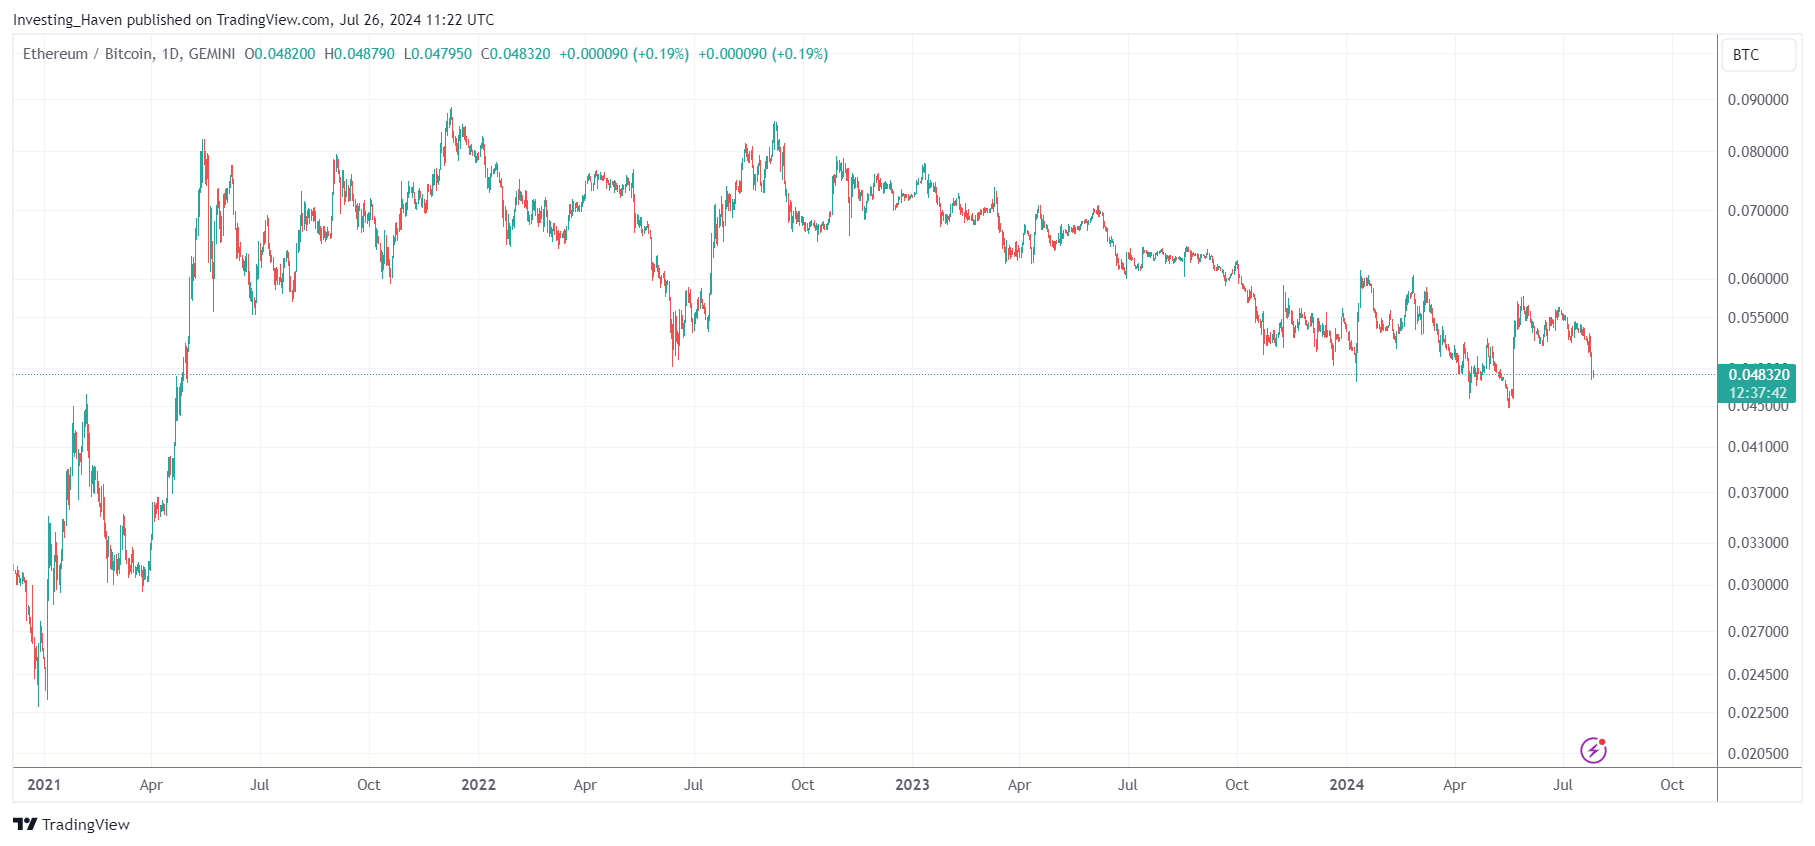
ETH has a track record of outperforming BTC but not so since August 2022.
We provide a short analysis of this 2-year downtrend in the price of ETH relative to BTC.
Ethereum price weakness – headwinds
A lot has been said about the new ETH ETFs.
The underlying assumption is that ETH ETFs will provide tailwinds for the price of ETH priced in USD.
RISK – This is is an assumption, be careful with this. While this will work out on a long term basis, it may not on the short to medium term. That’s because the price of ETH requires market momentum and market strength to do well.
Moreover, there are also other factors at play, like the one below.
So, before getting excited about the prospects of ETH ETFs and their bullish influences, please ensure to think holistically and consider all price influencers!
Grayscale’s $ETH ETF has seen over $1.1 billion in outflows in the first 3 days.
The sooner Grayscale stops dumping, the better it gets for $ETH.
At this rate, they should run out of $ETH in a couple of weeks.
Dump harder, Grayscale. pic.twitter.com/uAAKDR52Pv
— Lark Davis (@TheCryptoLark) July 26, 2024
Ethereum price weakness – a concerning chart
When priced in BTC, the Ethereum chart does not look good.
That’s an understatement.
It looks terrible to be honest.
Below is the daily ETHBTC chart. It’s a mess, in a 2-yeardowntrend, trying to stabilize now.
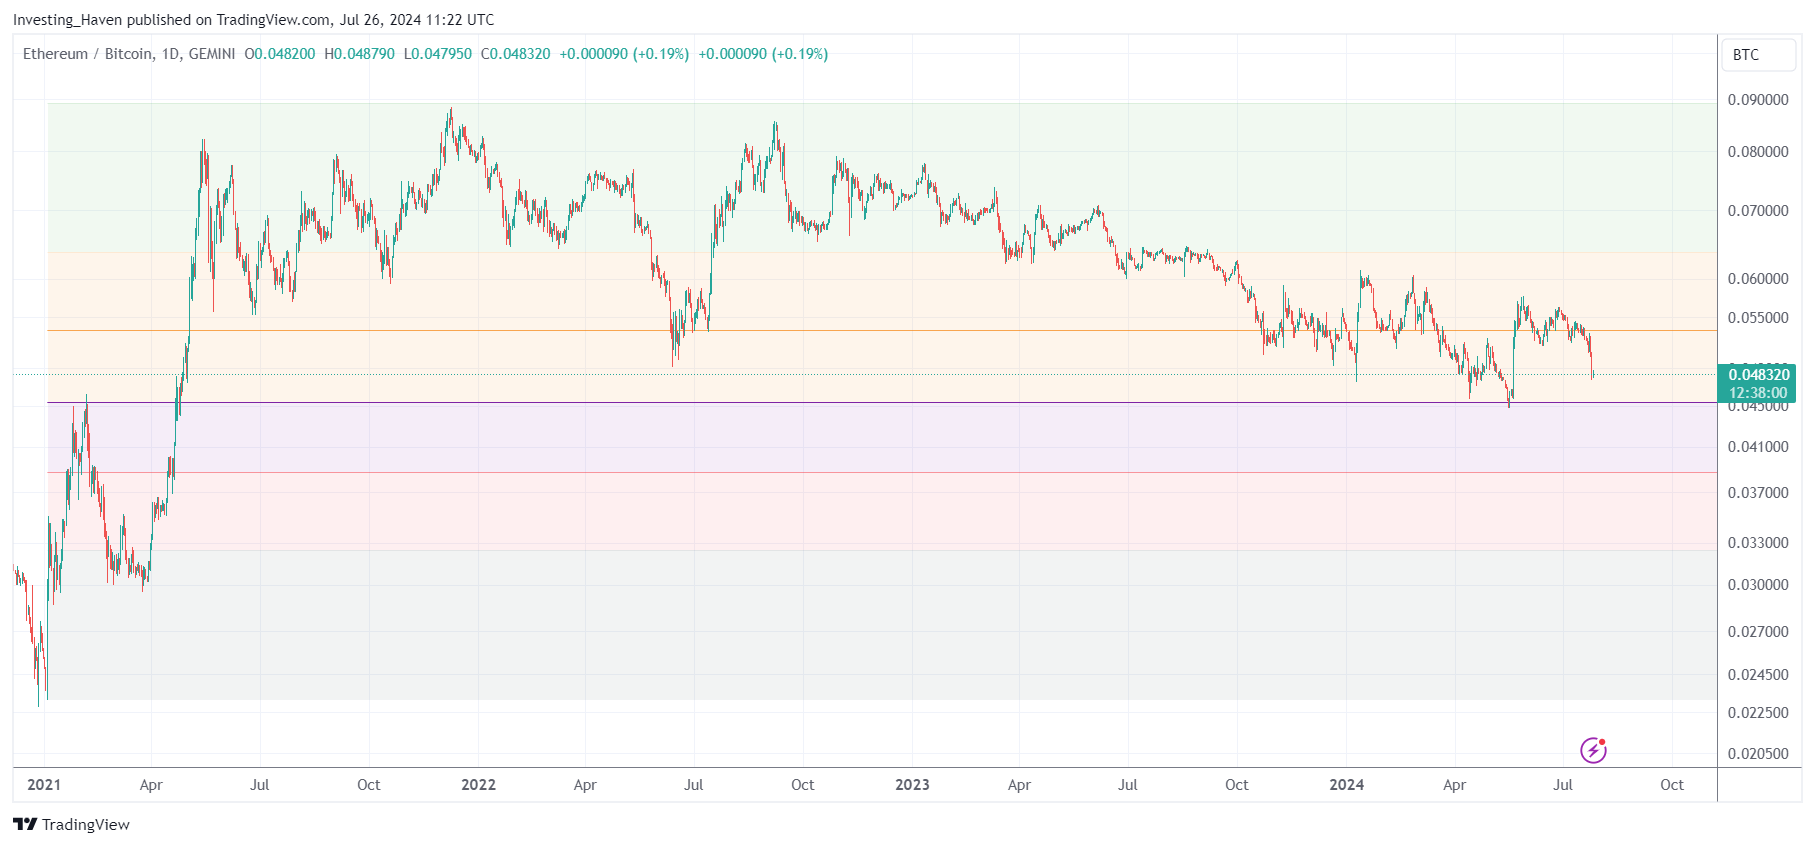
Ethereum price weakness – an annotated chart
The same ETHBTC chart looks much better when we add our annotations.
If anything, Fibonacci levels always helps assess a downtrend.
As seen, ETHBTC did find support, back in April and May, exactly at the 50% Fibonacci level. This is a key level, and this ‘event’ is meaningful. It is even fair to say that it’s critical, in our view.
As long as ETHBTC does not fall below the 0.045 level, it would be great news.
Ethereum price chart – buy the dip guidance
When looking at ETH in USD, we see a consolidation with lower highs since March.
This chart visualizes the underperformance of ETH relative to BTC.
While ETH has great fundamentals, it has no leadership status currently despite motivational influences from ETH ETFs.
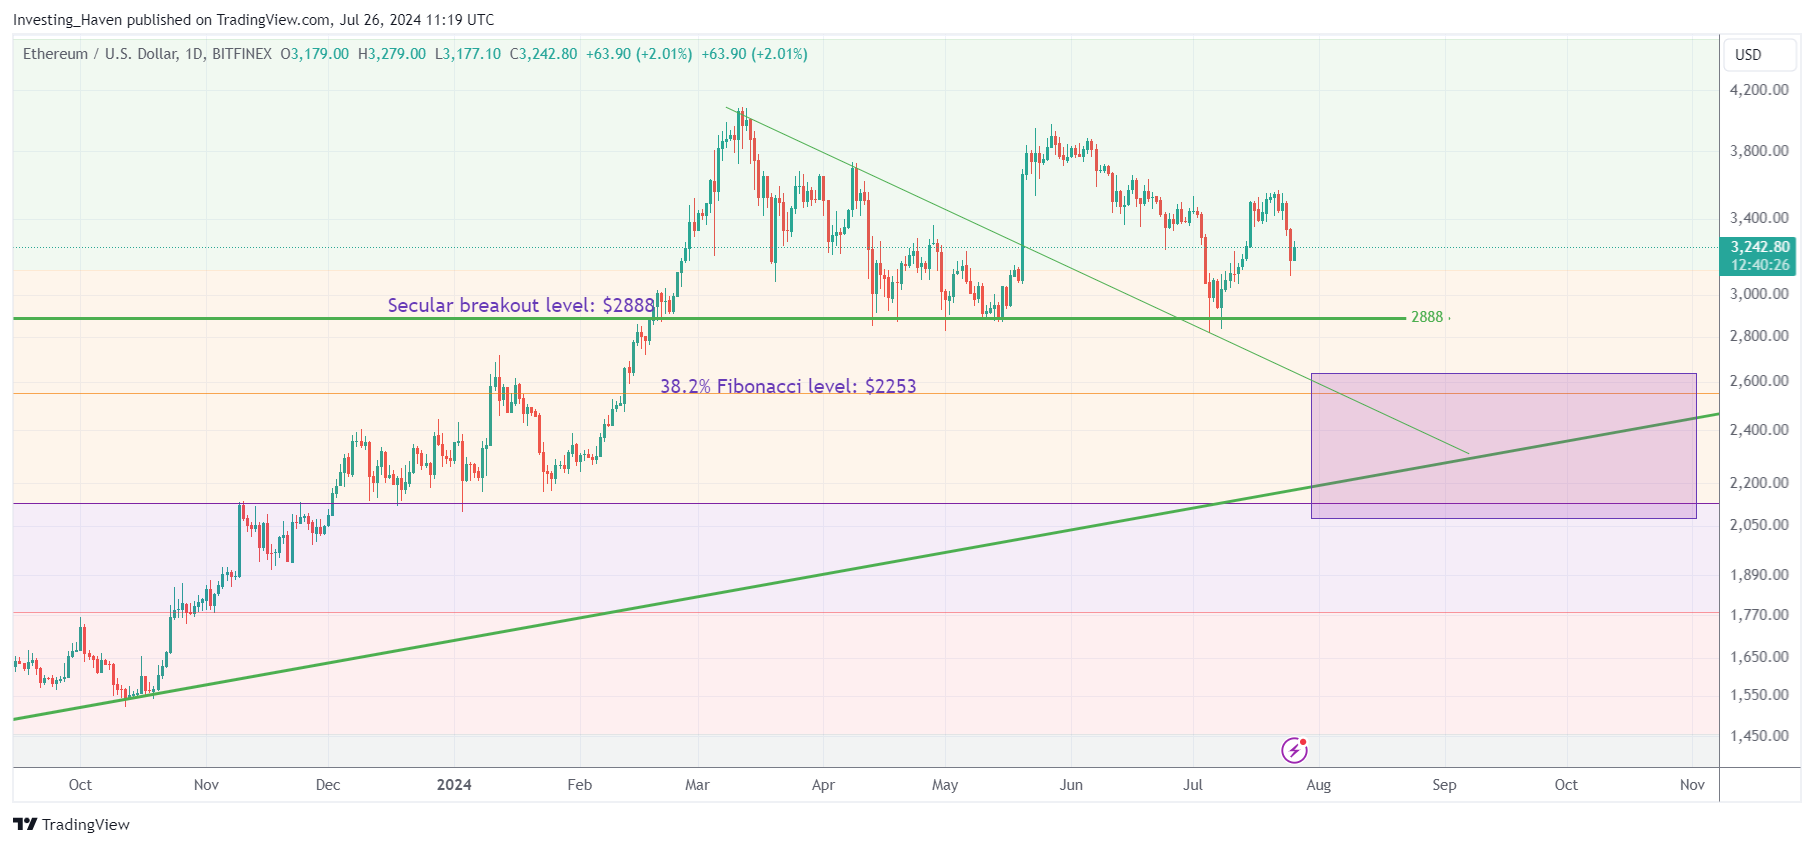
We argued, lately, that $2888 is the key level to watch in August of 2024. In case $2888 would not hold, it will be the area $2400-2600 that will be key.
READ – Ethereum Price Analysis for August 2024: This Is The Most Bullish Outcome For ETH
We believe that ETH will ultimately move to $5,600, largely exceed it, as suggested by this post:
A perspective on $ETH
Support was found at lower boundary of 4+ month rectangle, which was a retest of the Feb completion of a horn bottom
Target, pending upside completion, is 5600+ pic.twitter.com/EThcM61KpW— Peter Brandt (@PeterLBrandt) July 15, 2024
However, there might be more downside before ETH clears ATH. We believe, given the charts shown above, that Ethereum’s underperformance should be watched closely, also against the 50% Fibonacci level on the ETHBTC chart.
Ultimately, the ETHBTC should flash the buy signal once the relative underperformance turns into outperformance. This should be leading for ETH investors, not Twitter posts nor hope on headwinds by ETH ETFs.
In the meantime, we prefer what is happening on Solana’s ecosystem.
READ in our research area: The Next Big Wave + Two Solana Token Tips
While to some degree bi-furcated, there is significant activity ongoing on Solana’s network that makes us conclude that it will be the outperformer in the coming months and quarters.
LEGAL NOTE: A variation of this article was published on Medium.com and also TalkMarkets.com.

