
Based on the long term SOLBTC chart, we conclude that SOL has confirmed relative strength against BTC. This, ultimately, may confirm our ‘buy the SOL dip’ thesis.
Based on our most recent Solana price prediction, we conclude that SOL may well exceed ATH in 2025. All that’s needed is for SOL to respect $122 on the next dip.
RELATED – Solana Price Analysis: Why $122 Is Such A Hugely Important Price Point In 2024
The SOLBTC chart suggests that .0022 is the ‘line in the sand’ level for a very bullish outcome in 2025.
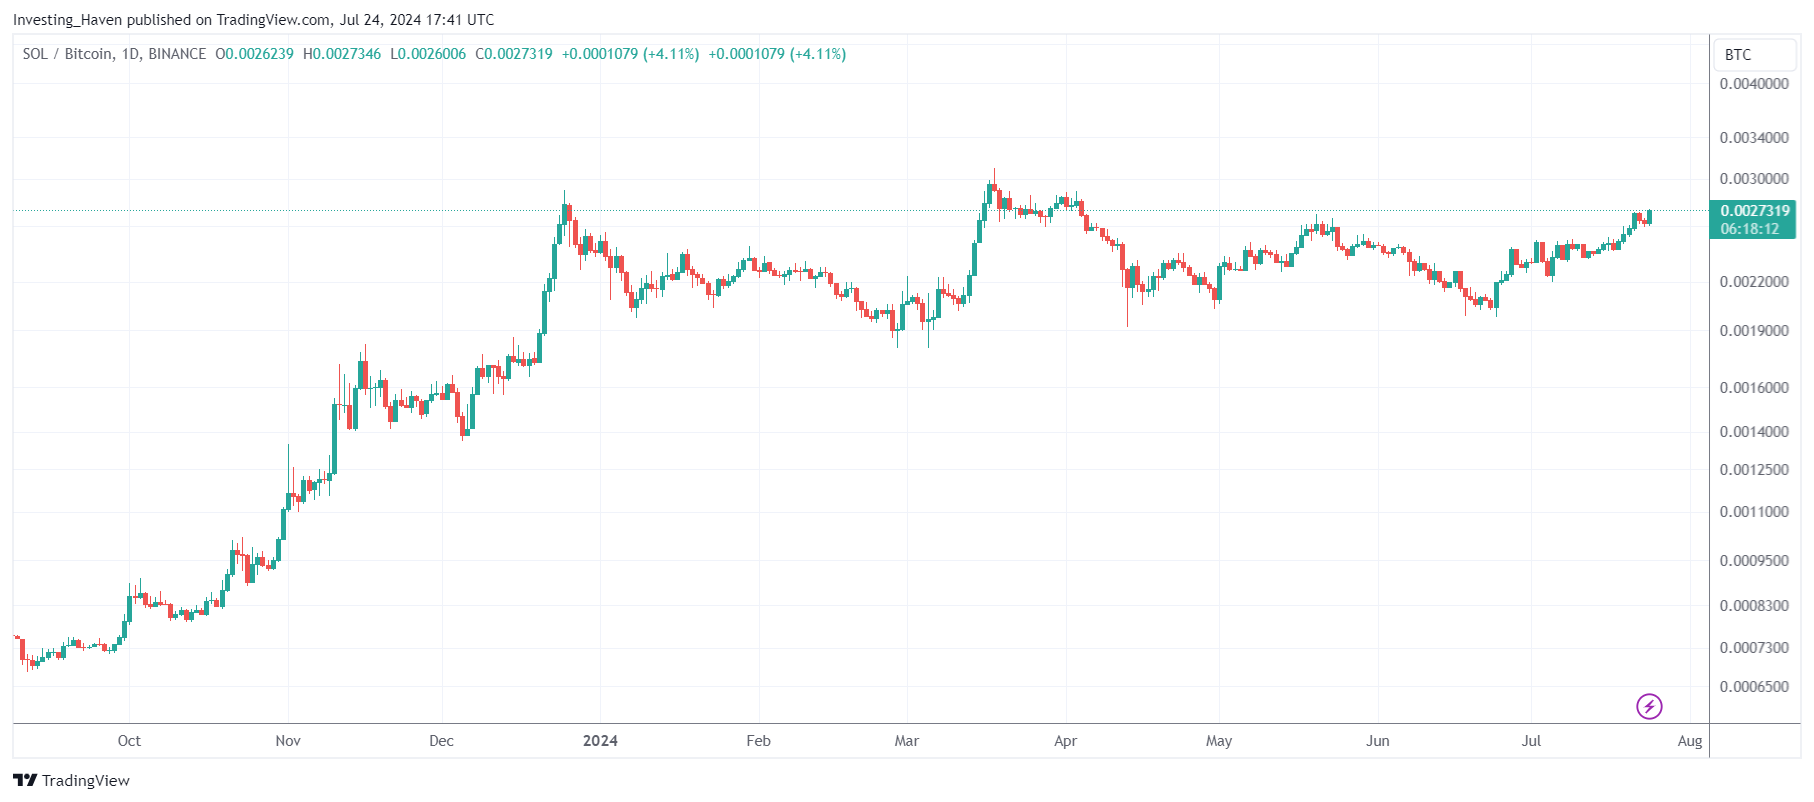
SOLBTC – Daily
The two Solana charts in this article are SOLBTC – that’s Solana priced in Bitcoin.
The benefit of tracking a token like SOL priced in BTC is of course relative strength.
When looking at the last 12 months, SOLBTC has created a bullish pattern. Essentially, it could well be a bullish ABCD pattern (upleg in 2023, retracement in 2024 so far, the subsequent leg higher could be the last part of this pattern.
What we want to see is a successful test of 0.0022 for this pattern to be very bullish. Invalidation: below 0.019.
Particularly the higher highs since March 2024 are very encouraging. One more higher high (which means a drop in both BTC and SOL with limited downside in SOL) could shape this SOLBTC chart into a beauty provided the 0.0020-0.0022 area is respected!
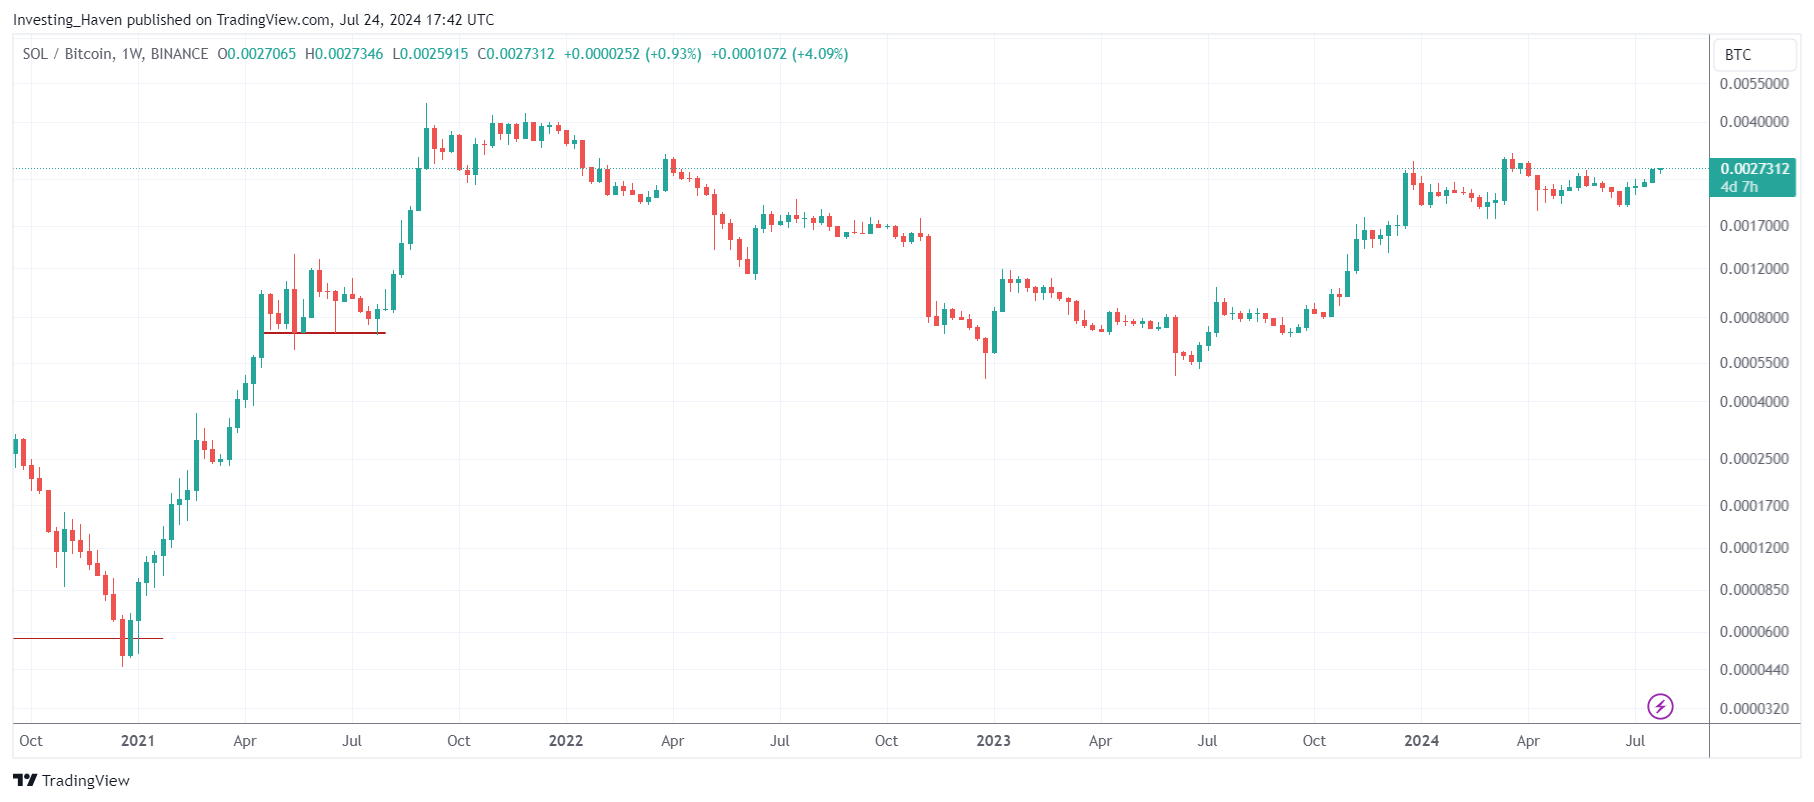
SOLBTC – Weekly
When zooming out, looking at the weekly SOLBTC chart, it gets really interesting.
The big picture pattern exhibits a very nice bullish reversal.
This gives investors very clear ‘line in the sand’ levels.
- Essentially, in terms of support, we observe an even higher level of importance (compared to the daily chart findings) of the 0.0020-0.0022 area. This area should really not give up on a 3-week closing basis.
- In terms of upside, there is a breakout point at 0.0044 which likely coincides with the SOLUSD breakout around $250 – no new insight here.
Stated differently, the 0.0020-0.0022 area in SOLBTC is, by far, the most important data point for investors as a support area. This should be combined with the importance of $122 on the SOLUSD chart.
A Wildly Bullish Reversal on Solana’s Long Term Chart
Even the SOLUSD chart is improving as evidenced by this chart:
Random ramblings of a relic
It can be argued that $SOL broke out
This is NOT a signal for me because I consider this to be a diagonal pattern
I do not consider this a BO until May high is penetrated but by then the R:r is not favorable pic.twitter.com/65s5NAoRmJ— Peter Brandt (@PeterLBrandt) July 24, 2024
What we like more even is the bullish reversal pattern on the long term SOLBTC chart, the one shown above.
This pattern suggests that SOL has lots of upside potential whenever the next bullish window in crypto markets starts. This is likely going to be late this year, with 2 very specific dates that we retrieved from our deep crypto research.
Our research revealed two specific weeks in the coming 3 months that will give us decisive information about the state and future of crypto markets.
- Date 1: a specific week in August.
- Date 1: a specific week in October.
Want to find out the exact dates and weeks? Our research insights are available in this article (sign up required) in the restricted area of our website: Where and When Could Bitcoin Bottom: Price & Timing Targets

