On August 5th, 2024, the price of Solana (SOL) experienced an intraday change of 21%. The big dump followed by a strong ‘pump’ felt encouraging. However, the ‘volatility window’ is not over. The fact that SOL closed above its critical level $122 is meaningless at this point in time.
RELATED – Solana: Prepare To Buy The Summer 2024 Dip
August 5th, 2024, was a day for history books.
- On the one hand, the crypto dump was hefty but the subsequent intraday recovery was equally astonishing.
- On the other hand, InvestingHaven’s research team had identified August 2nd, 2024, as the start of a volatility window in crypto markets and broad markets. It was another unusually accurate market call.
We expected a big drop in crypto starting August 2nd, as evidenced by writings which were published back in May of 2024, still available on our Solana price prediction and ETH prediction sections.
Solana price – the importance of $122
We cannot stress it enough: the most important price on Solana’s price chart is $122.
RELATED – Solana Price Drop: How Concerning Is It Short Term vs. Long Term?
The important thing to realize is that $122 is crucial on all timeframes, first and foremost the long term timeframe.
That’s because $122 is the ‘line in the sand’ level – if SOL would fall below this level, it will create the second part of what is expected to become a cup and handle. That’s a very bullish pattern, to be clear.
But cannot observe this is your timeframe is narrow or short term oriented.
While we agree with the relative strength observation of the following X post, we thoroughly disagree with the timeframe that was chosen for Solana’s chart. It’s a horribly bad idea to take a daily chart of less than 6 months to come to any meaningful conclusion about a dominant chart pattern.
One thing of note is the absolute monstrous strength $SOL shows, whether it’s rain or shine.
I think it’s pretty much a given that this chart resolves up for ATHs at some point.
There simply are more buyers than sellers. pic.twitter.com/uQk3rrW5DQ
— Eugene Ng Ah Sio August 6, 2024
Solana on the timeline – August volatility window
The ongoing volatility is not a fundamental thing. On the contrary, in fact, Solana’s fundamentals look really good.
It’s not fundamentals that create volatility.
The timeline creates volatility.
We said in many of our previous writings, but we’ll emphasize it again:
Timeline analysis is much more important than price analysis. Ultimately, a complete picture can only be created when combining timeline and price readings.
This is what we wrote throughout the month of July in our crypto research alerts, available in the restricted area:
- “We have very clear time + price levels to watch for a final and lasting sell-off bottom in BTC. In terms of time: the last week of August or around Oct 20th.” (July 7th, 2024)
- “Specifically the month of August is expected to be volatile according to our timeline analysis.” (July 14th, 2024)
We also shared the following time period which will come with elevated levels of volatility: August 2nd, 2024 till August 28th, 2024.
What nobody can predict exactly is when volatility will pick up, during a volatility window. So, it might be that volatility levels will come down until end of August.
What matters, however, is that the volatility window is going to last 3 more weeks. So, a lower low in crypto markets may be set, or a re-test of the August 5th lows might be next. It’s impossible to forecast this.
Solana price & time chart
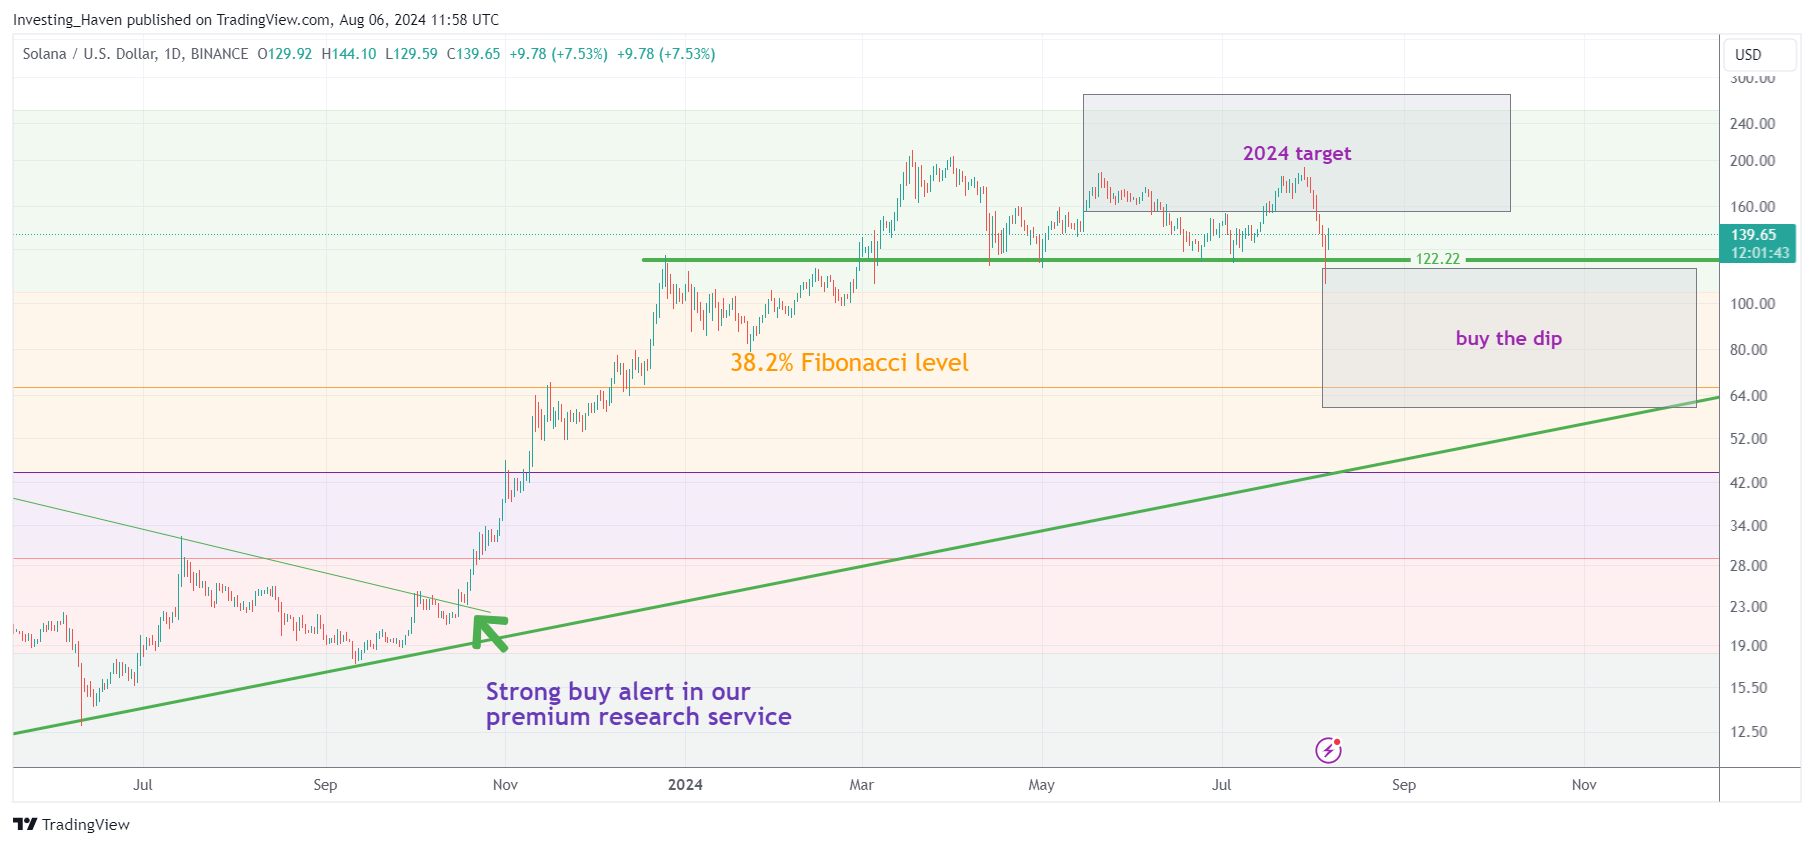
If we combine time and price readings on Solana’s chart, mapped to our forecasted min and max price areas on the timeline, we see the following:
- Solana perfectly respected our 2024 target area.
- On the 3d day of our predicted volatility window, SOL entered our predicted ‘buy the dip’ area.
- There is still a long period of 4 months approximately in which dumps may be expected. We are not per se forecasting lower lows, but we are certainly forecasting an extended period of volatility.
- A bottoming formation, in whatever shape or form, is what Solana will need in order to be bullish in 2025.
The problem with the current chart structure – the pattern is incomplete – it certainly is not a chart pattern that is ready to turn into a powerful bullish trend.
That’s why it is imperative to give time and space.
SOL looks good, but not ready to continue its uptrend.
We are very interested in Solana’s ecosystem, as we track towards buy signals on 2 Solana ecosystem token tips (shared in our premium service and available in the restricted research area).

