
The price of Solana (SOL) continues to consolidate right above $122. While seems to be good news, there is a very important dominant resistance dynamic which is a 6-month falling trendline. Solana investors should take this falling trendline very seriously.
RELATED – Solana Price Drop: How Concerning Is It Short Term vs. Long Term?
Most Solana price analysis on the internet is pretty short sighted, biased, isolated, or a combination. That’s not helpful, and almost always leads to the wrong conclusions (tons of illustrations of this problem can be found in Google News).
Very often, it is simplicity that can solve this problem.
In this blog post, we look at the daily SOL price chart, zoom out sufficiently to find the dominant dynamics but also understand dynamics that are relevant in the short term!
SOL price analysis – no new ATH any time soon
As explained in our SOL price prediction research, we were not bullish for August.
We continue to be very bullish for 2025.
In other words, the risk in 2024 is not ‘missing out’ but finding where the floor will be. Our predicted SOL support area is $82.84 – $122.22. This does imply that SOL will and must drop to $82.84, it says that a drop in the indicated area will occur.
And it happened – SOL dropped below $110 on August 5ht, 2024, exactly as predicted in the predicted price range.
Unlike this popular post on X, we are not bearish. We certainly are not bullish short term, we remain bullish long term.
.$SOL has reached its peak price for this cycle
. pic.twitter.com/4D2ar6u4si— @RAFAELA_RIGO_ August 18, 2024
No evidence of SOL peak price at this point in time simply because BTC has still much more upside potential as explained in our latest BTC prediction. Remember – you cannot analyze tokens like SOL in isolation without considering BTC and broad market trends, it’s one of those big mistakes mentioned in our intro. There is no evidence of SOL peak price.
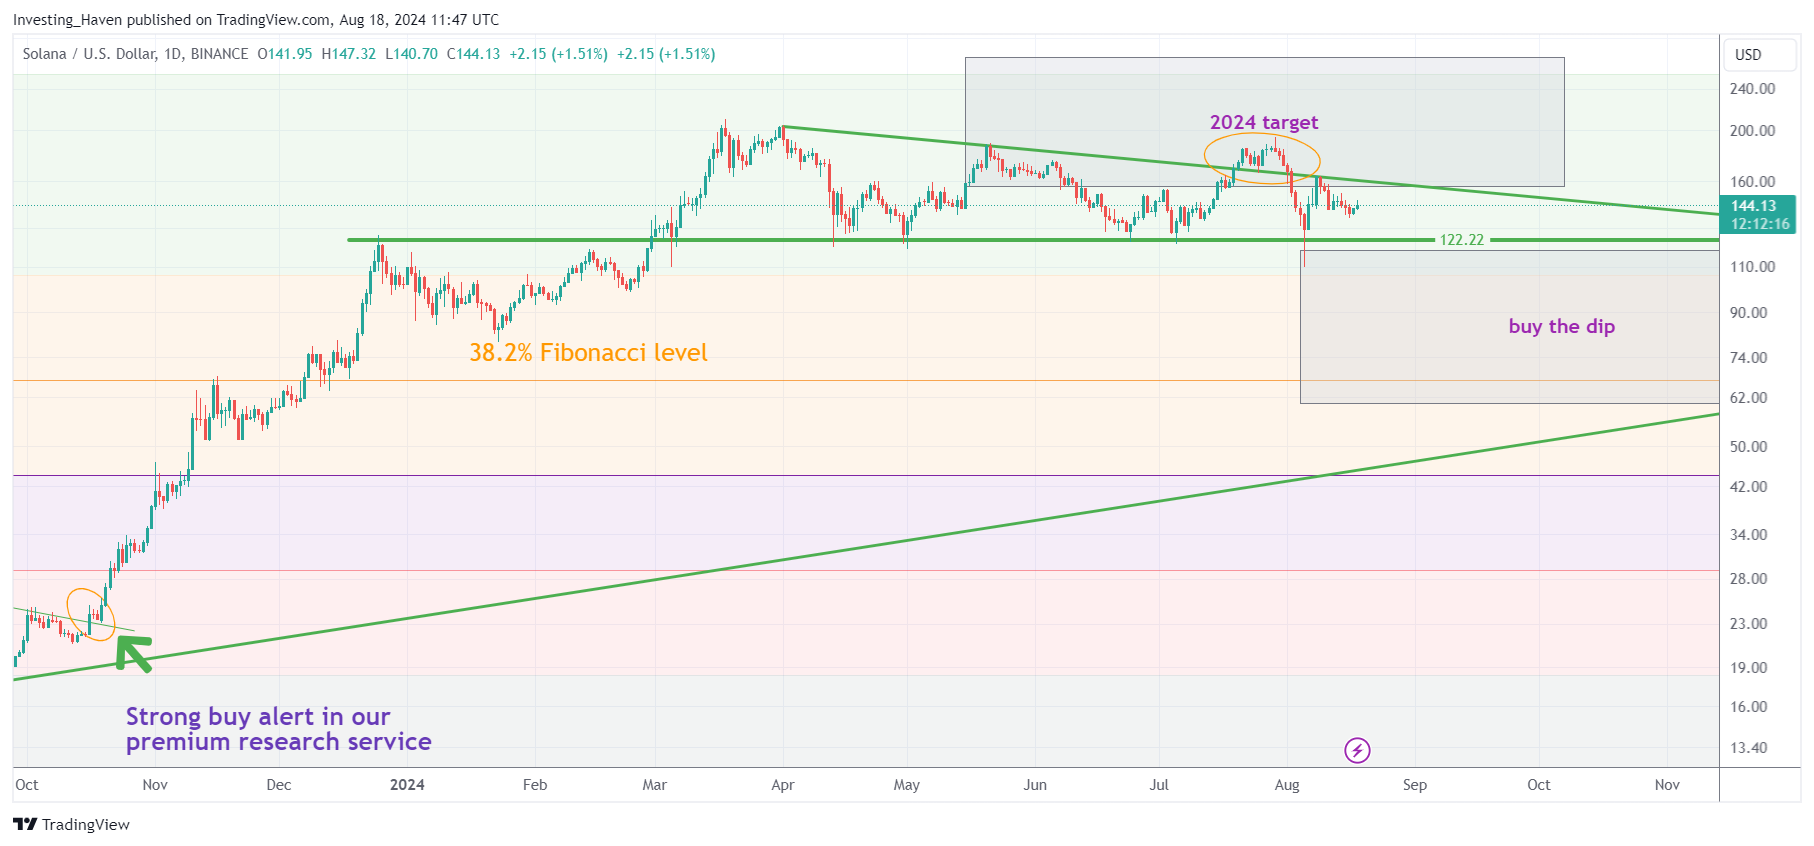
SOL price chart analysis – mind the falling trendline
Below is the daily SOL price chart.
As said before, there are some major traps to avoid:
- Short term price chart – this turns price analysis irrelevant.
- Missing dominant trends – this leads to wrong conclusions.
- One directional price analysis – any chart analysis requires to happen in 3 directions (horizontal, vertical, sloped).
When looking at the SOL price chart, the relevant view, the most important SOL price dynamics are:
- The extremely important horizontal level $122.22.
- The Fibonacci levels indicated with colors on the next chart – the 38.2% ($70) and 25% ($110) levels are key.
- The fast rising long term rising trendline which currently is crossing Solana’s 50% Fibonacci level at $43.
- The 6-month falling trendline.
The latter is, by far, the most important dynamic for the coming weeks and months.
SOL price – a short term forecast
We don’t see a breakout in the price of SOL in the short to medium term.
The falling trendline is too dominant.
In fact, the July breakout, as highlighted on the above chart (yellow circle) invalidated after 5 and 8 days, Fibonacci numbers, confirming the invalidation.
Our SOL price forecast for the coming weeks and months – SOL will be range bound between $122 and $160, any breakdown or breakout will invalidate within a period of 5 to 8 days.

