The price of Solana (SOL) is close to hitting $122 again, the 6th time in 6 months. This an epic support level which is why this test of support may have major implications. In this Solana (SOL) price analysis, we review the SOL chart and possible outcomes.
The importance of $122 for SOL is huge.
It is a make or break level for the short to medium term.
Solana (SOL) – the importance of $122
First, let’s summarize what we wrote in this article written back in July 2024:
Solana Price Analysis: Why $122 Is Such A Hugely Important Price Point In 2024
The 3 key points we made, all of them still very relevant:
- All whales have on $122 as a critical price point on their chart.
- We are not predicting that SOL will not fall below $122 in 2024 or 2025.
- What we are saying: IF SOL doesn’t fall < $122 it would be the most bullish possible outcome for 2025.
Now, with that said, we would like to emphasize what we wrote in our prediction research:
Solana (SOL) Price Prediction 2025
SOL needs to drop in 2024 in order to create the most bullish possible chart structure, ensuring a very bullish outcome in 2025: a bullish cup-and-handle.
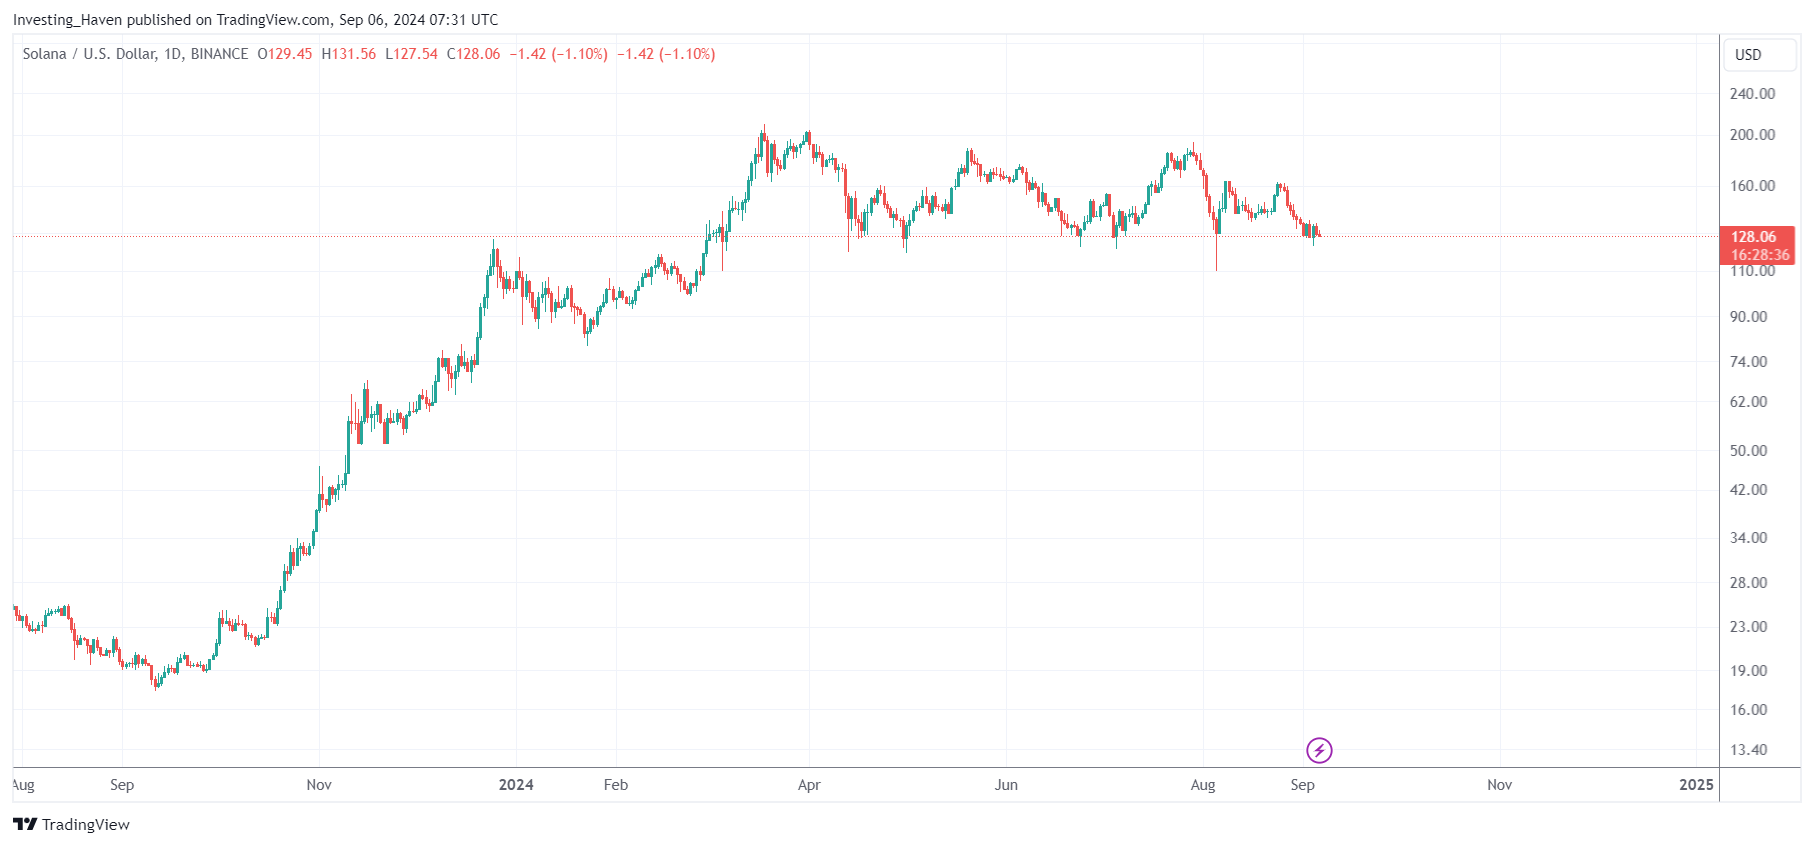
Solana (SOL) testing epic support
Looking at the daily price chart of Solana, the importance of $122 is instantly clear:
- The 6ht test of $122 is happening now.
- A drop below $122, for more than 5 to 8 days, will have major implications on this chart structure.
- Solana is not ready to create bullish momentum – this chart structure needs to improve.
Remember, SOL went up 8x, visible on this chart. This market dynamic is important:
A huge run requires a huge break – that’s how markets function.
While this chart has no annotations, it certainly helps in visualizing the importance of $122.
In the meantime, we notice an important shift in the cash tag $SOL – a focus on the very short term. The SOL charts are very short term oriented.
That’s not good – whenever important ‘events’ occur on a chart, the focus should be long term – zoom out.
Similarly, we find quite some misleading posts, like this general crypto post:
Retail panicking.
Whales accumulating.
The true pain comes when they run it back up.
The real question is – what happens is support gives up?
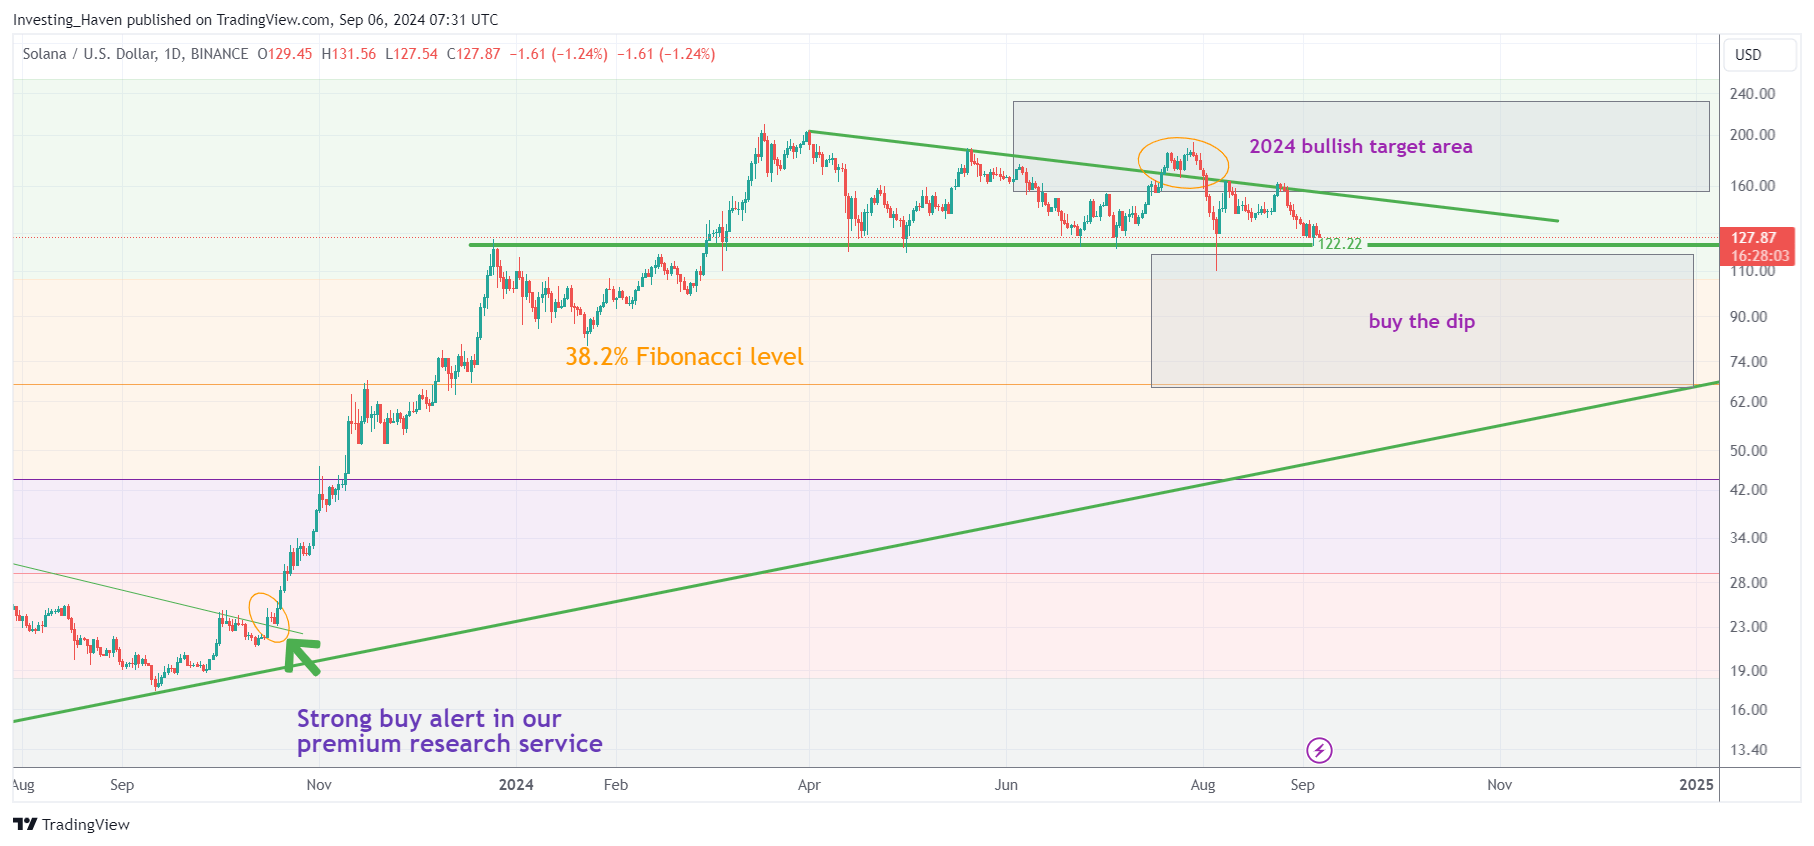
Solana (SOL) chart structure
To the last point, here is what happens when support gives up, see below.
The same SOL chart, now with our annotations emphasizing dominant chart patterns:
- SOL might need to drop in the ‘buy the dip’ area.
- That’s the area between the very bullish Fibonacci levels: 25% and 38.2%.
- A very important multi-year rising trendline is visualized in green.
Remember, a drop in price is not necessarily bad as long as it respects dominant chart structures.
RELATED – Solana Price Drop: How Concerning Is It Short Term vs. Long Term?
This applies to SOL – a drop in the $70 to $90 area is not bad in the grand scheme of things.
Solana (SOL) – possible outcomes
Frankly, the SOL charts suggest that a drop might occur.
A SOL price drop to $90 is not a bad outcome, on the contrary.
What matters is this:
- Dominant chart patterns need to be respected (and tested).
- Bullish Fibonacci levels need to be respected (and tested).
In all our predictions, we mentioned that Aug/Sept would be a weak period.
We also added this, already 4 months:
Crypto Timeline Insights: Why October 2024 Will Be Decisive (must-read analysis on our Linkedin page)
We prefer to let the market do its work in September, and re-assess in October.
Patience will be rewarded.
That’s what the charts are signaling right now.

