With easing inflation, solid consumer confidence and employment metrics, the U.S. economy is set to grow. Market breadth is improving. The S&P 500 is set to continue its rise in 2025, directionally.
RELATED – 10 market forecasts for 2025.
For this forecast, we use core metrics, economic data primarily, and complement them with our own charting. This data driven way is the basis for our S&P 500 outlook 2025.
We analyze:
- Earnings growth.
- Labor market data.
- Inflation expectations.
- Market breadth.
- S&P 500 charts.
We aim to provide a comprehensive perspective on the forces shaping the market in 2025. They all confirm a bullish outlook for stock markets in 2025, although we hasten to say that bi-furcation in the form of sector rotation is going to make it challenging for most investors.
An S&P 500 forecast for 2025 (*):
| Year | S&P 500 forecast |
|---|---|
| 2025 lows | 5,450 points |
| 2025 highs | 6,560 points |
| 2025 average | 6,005 points |
| Bullish invalidation | < 4,950 points |
(*) This quarterly forecast is subject to change based on intermarket dynamics and ongoing market trends.
S&P 500 at the time of updating this article (Jan 1st, 2025): 5,903 points. Courtesy of Yardeni for the economic data points featured in this article.
Labor Market: Unemployment Stable, Productivity Strong
The unemployment rate ticked down to 4.2% in August 2024, slightly lower than July’s 4.3%.
However, it remains elevated compared to the 3.4% seen at the start of 2023.
Interestingly, there hasn’t been a significant rise in job losses, but job openings have declined, making it harder for job seekers to find employment. This points to a shift in the labor market where employers are holding onto workers but becoming more cautious about hiring.
Key Insight: Productivity Gains Could Offset Slower Hiring
One critical factor influencing job openings may be productivity gains. With businesses becoming more efficient, they require fewer new workers to maintain output. If the Federal Reserve embarks on aggressive rate cuts in 2025, the result might be faster GDP growth, but much of that growth could come from productivity enhancements rather than job creation.
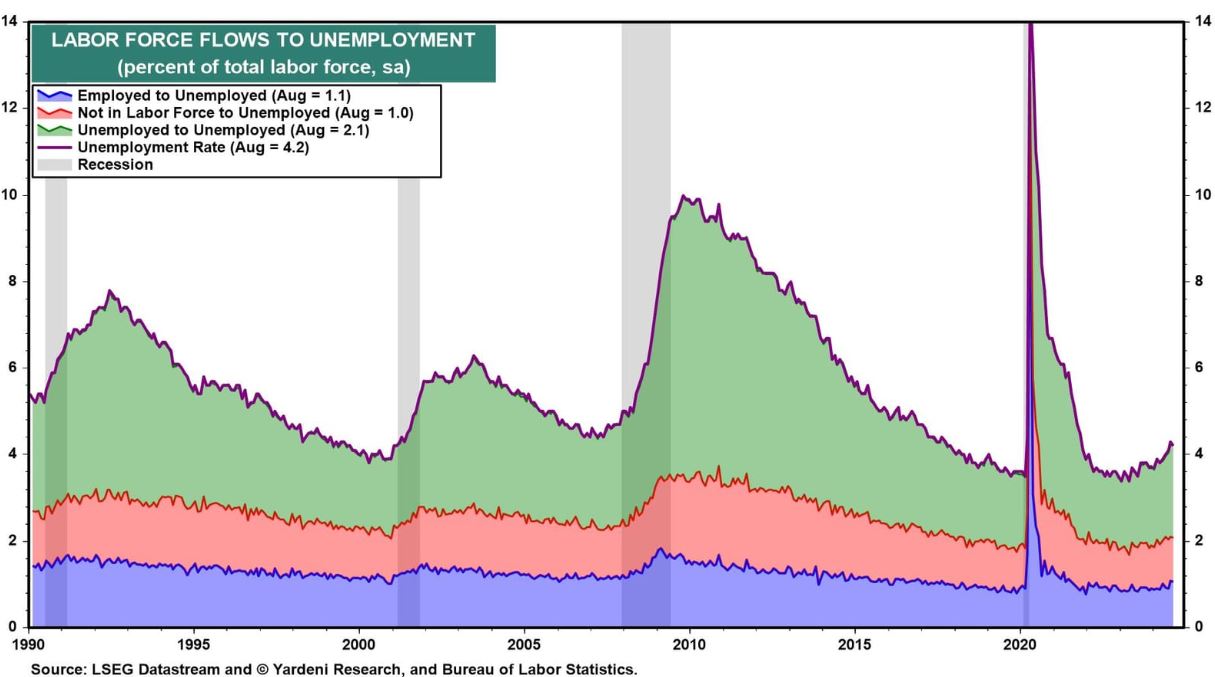
How this data point affects our S&P 500 outlook 2025 – This dynamic creates a unique opportunity for the S&P 500. While slower job growth may typically signal economic weakness, higher productivity could boost corporate profit margins, leading to a favorable environment for stocks.
Take-away: This data point underpins a directionally bullish outlook for the S&P 500 in 2025.
Inflation Expectations Easing, Fuel Consumer Confidence
The consumer sentiment surveys indicate that inflation expectations one year ahead are set to decline (source), a sign of confidence among consumers that inflationary pressures are cooling (source).
Key Insight: Cooling Inflation Supports Consumer Spending
Historically, high inflation has acted as a brake on consumer spending, but with inflation expected to ease, consumers are more likely to open their wallets, which in turn stimulates the economy and supports stock prices.
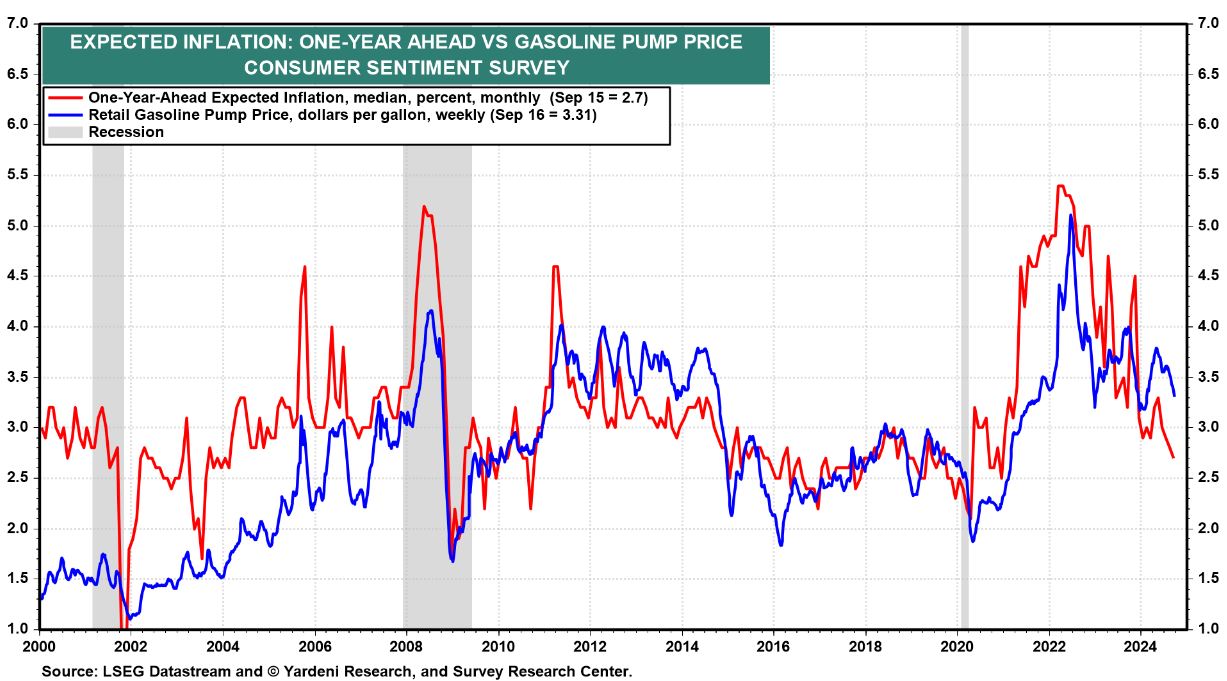
How this data point affects our S&P 500 outlook 2025 – The cooling of inflation has positive implications for both consumer sentiment and corporate margins.
- If inflation continues to ease in 2025, consumer-driven sectors, such as retail and services, will likely benefit the most.
The resulting increase in consumer spending power would be a major driver of economic growth, adding another pillar of support for the S&P 500.
Take-away: This data point drives a bullish outcome for the S&P 500 in 2025.
Wages and Retail Sales: Economic Stability
Both wages and retail sales have shown steady, albeit moderate, growth. This combination is essential for the long-term stability of the economy.
Rising wages increase consumer spending power, while steady retail sales indicate that consumers are continuing to spend despite economic uncertainties.
Key Insight: Wages and Retail Sales Form the Backbone of Market Strength
The gradual rise in wages and retail sales represents a positive feedback loop that could support the broader economy in 2025.
- As income levels rise, consumers are more inclined to spend on discretionary items, which boosts corporate revenues.
This, in turn, creates more opportunities for earnings growth, particularly in consumer-facing sectors.
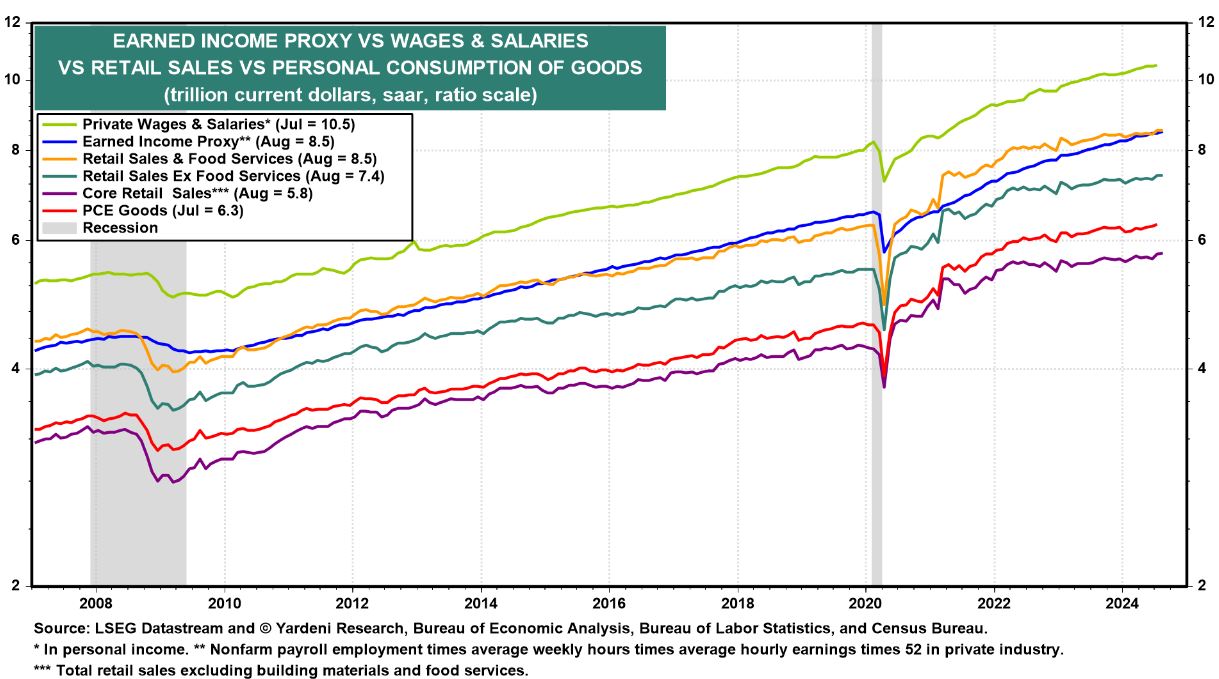
How this data point affects our S&P 500 outlook 2025 – The S&P 500 will likely benefit from these trends, with companies that rely on consumer spending seeing strong performance. As wages and sales continue to rise, they provide a solid underpinning for economic stability and a favorable market outlook.
Take-away: This data point sets a bullish foundation for stock markets in 2025.
S&P 500 Earnings: Forward Growth Continues to Set Records
Corporate earnings have been a pillar of strength for the S&P 500, even in the face of tight monetary policies. The chart depicting S&P 500 Operating Earnings Per Share (EPS) shows that forward EPS continues to trend higher, and this growth is expected to accelerate in 2025, especially if the Federal Reserve shifts toward a more dovish stance.
Key Insight: Earnings Growth to Drive Market Gains
Despite the Fed’s recent tightening, the economy has grown at a moderate pace, indicating resilience. Should the Fed aggressively lower interest rates, we anticipate that forward earnings could break new records, providing a strong tailwind for stock prices.
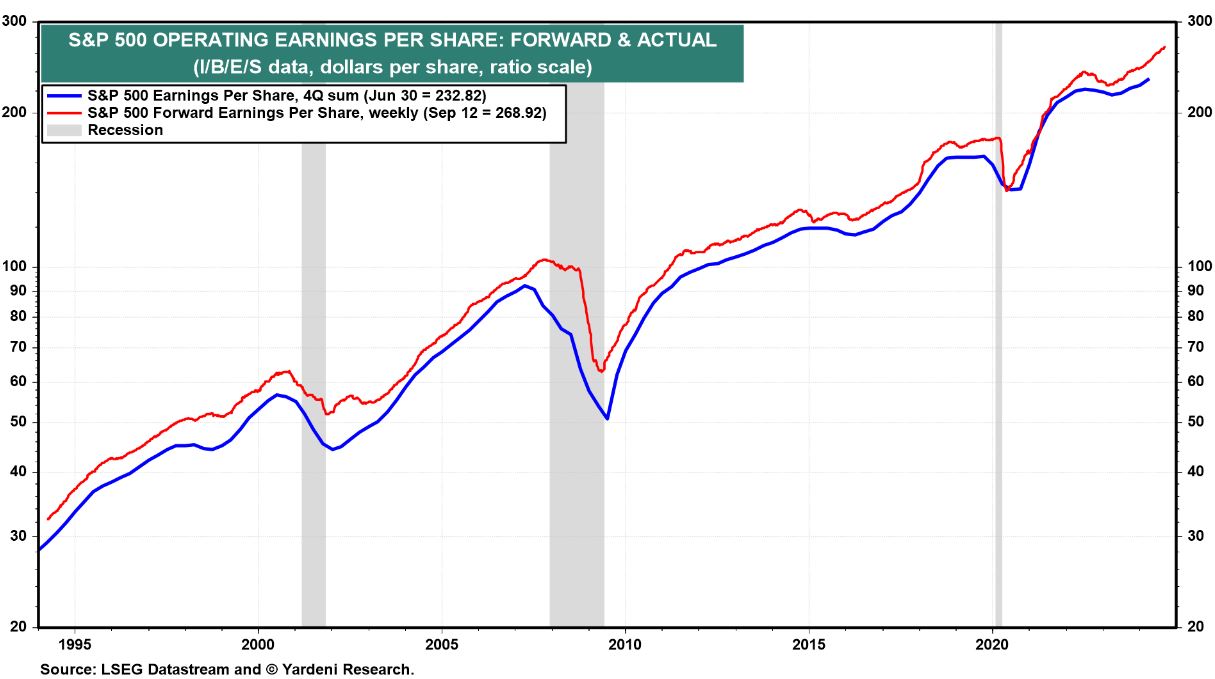
How this data point affects our S&P 500 outlook 2025 – Forward earnings growth is a critical metric in our positive outlook for the S&P 500. As the economy accelerates, sectors like technology, healthcare, and consumer goods could benefit most from this earnings momentum, reinforcing their market leadership in 2025.
Take-away: This is strongly bullish for the S&P 500 in 2025.
Market Breadth Improving
One of the more positive developments heading into 2025 is the potential for increased market breadth. The comparison of the S&P 500, 400, and 600 indexes shows that while large-cap stocks have led the market, small- and mid-cap stocks are beginning to recover as well. This signals that the bull market could broaden, with more sectors and industries contributing to market gains.
Key Insight: Fed Dovishness and Broadening Market Participation
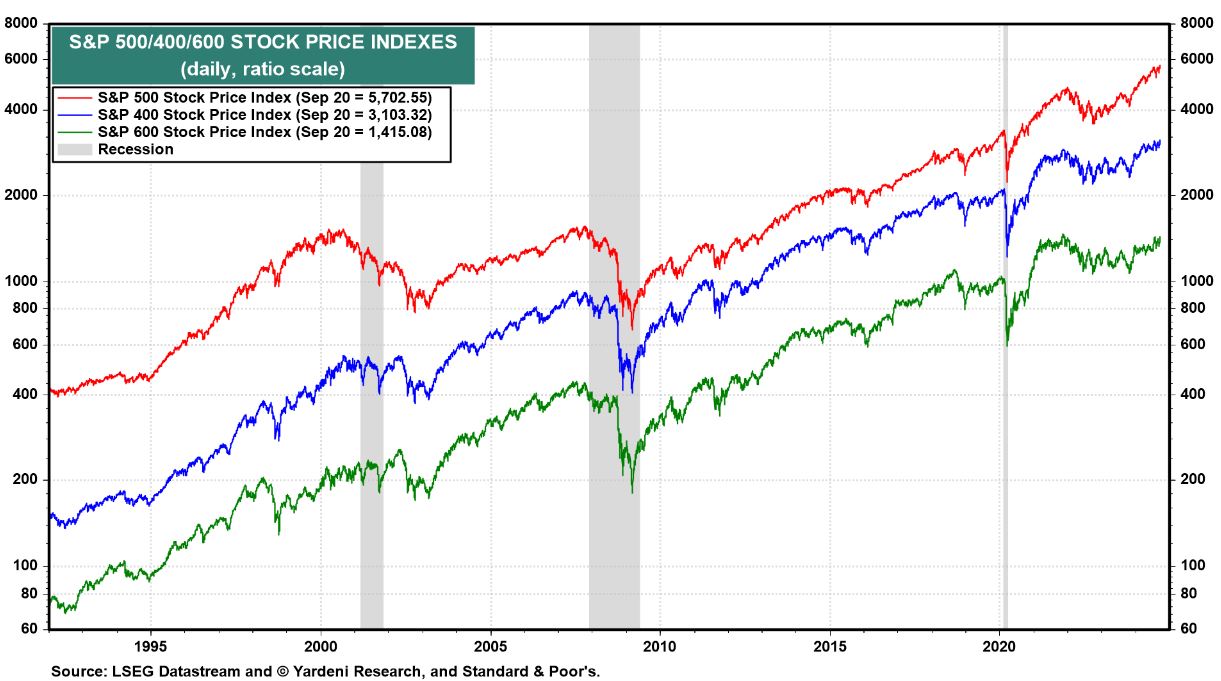
How this data point affects our S&P 500 outlook 2025 – A combination of better-than-expected economic growth and a more dovish Fed could further broaden the market rally. As small- and mid-cap stocks begin to catch up with their large-cap counterparts, the S&P 500 may experience a more inclusive bull market. This broader participation is a sign of a healthier market and could lead to sustained growth throughout 2025.
Take-away: In essence, this last chart is the bullish stock market forecast for 2025.
Long term S&P 500 chart
With all the economic and fundamental data outlined above, we now map those data points to the S&P 500 charts.
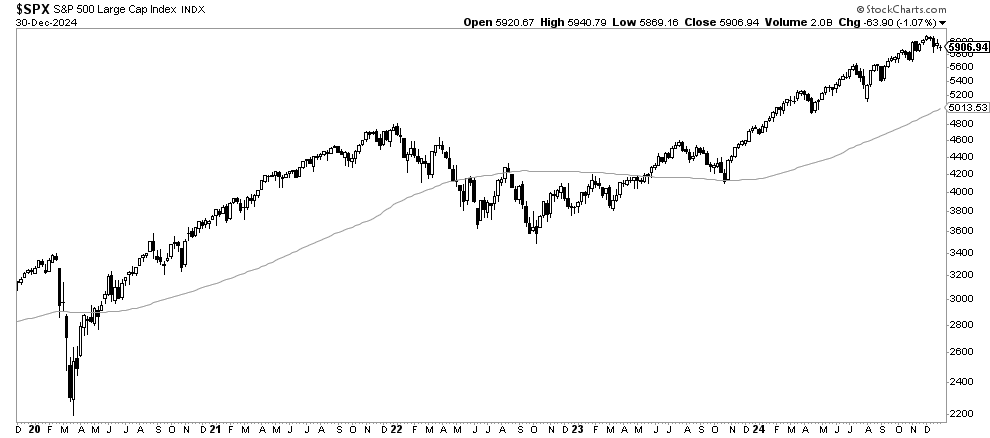
The weekly chart, featuring 5 years of price action in the leading S&P 500 index, has essentially 4 structures:
- The quick crash and recovery in 2020.
- The uptrend in 2021.
- The bullish reversal in 2022.
- The uptrend that start early 2023.
This structure is not showing signs of topping nor slowing down. Other than regular and healthy pullbacks, this chart suggests a continuation, directionally, of the S&P 500 rise.
January 1st – This chart structure, essentially, confirms a bullish outlook for the S&P 500. A pullback can be expected, based on the chart pattern we might see 5,400 to 5,600 being tested early on in the year. The 90 week moving average is the deepest it can go, we don’t see a pullback below 5,400 though.
A precise S&P 500 prediction 2025
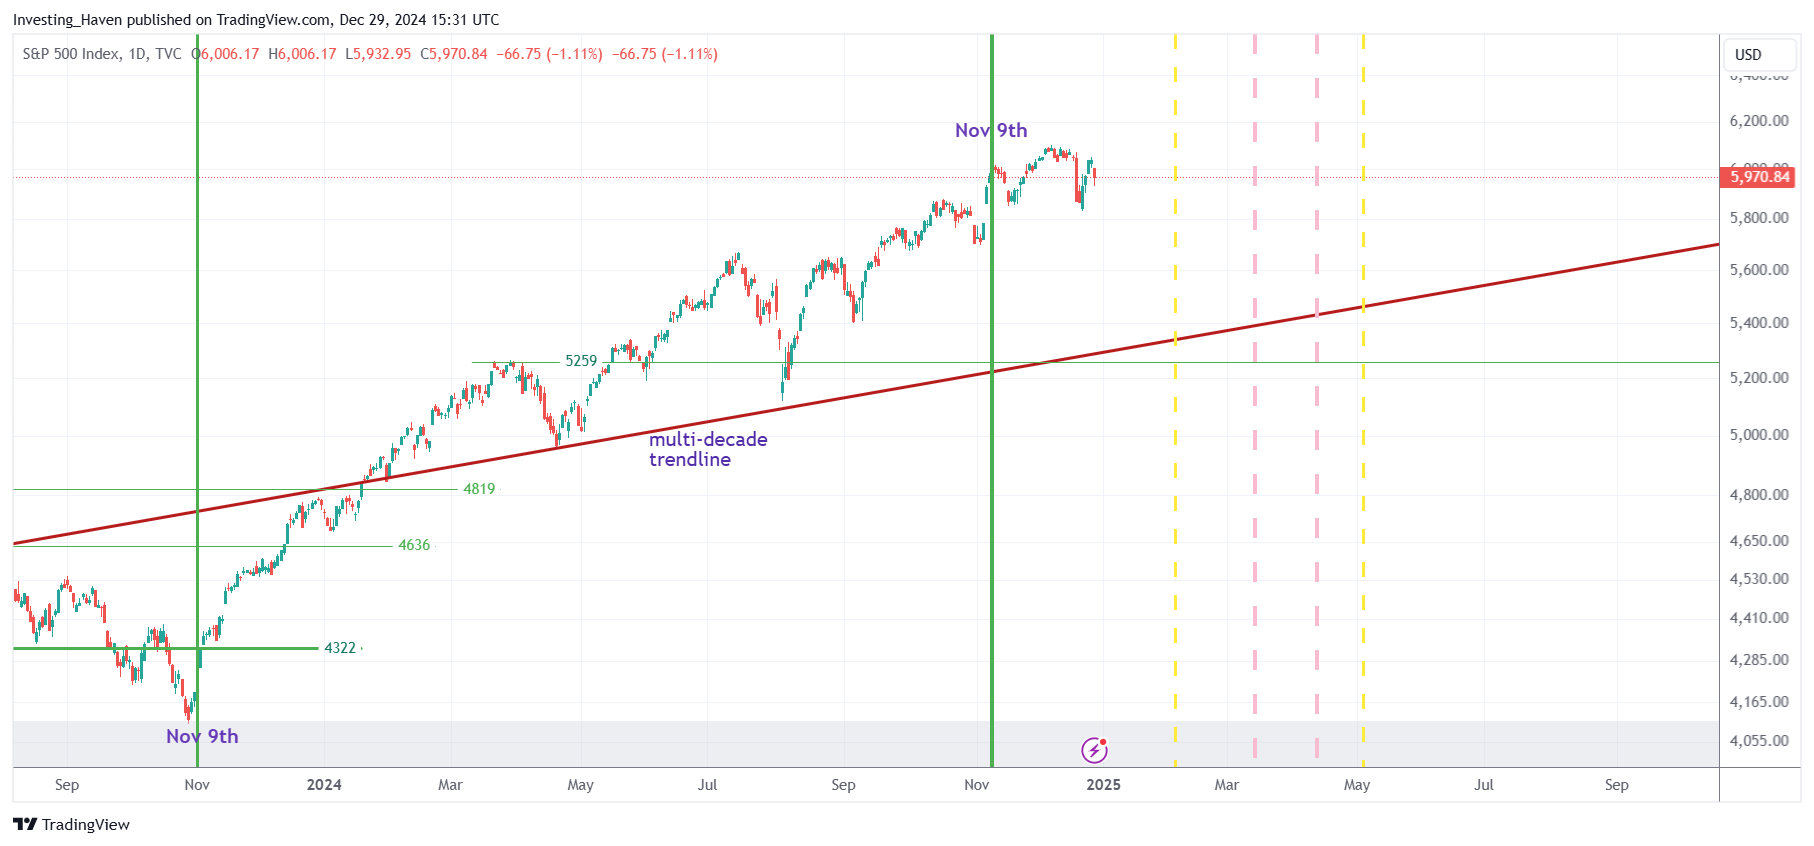
With the data points and chart structured outlined before, we believe that the S&P 500 rising channel is set to remain dominant in 2025. This chart pattern suggests that 6,500 points should be hit at a certain point in 2025.
S&P 500 forecast for 2025:
- Forecasted lows in 2025: 5,450
- Forecasted highs in 2025: 6,560
- Forecasted average in 2025: 6,005
The S&P 500 chart suggests that the multi-decade rising trendline may be hit as support in 2025.
January 1st – This short term oriented chart suggests (a) strong momentum as of the first yellow dotted line which is February (b) a consolidation in the period between the pink dotted lines (c) high intensity in the week marked by the second yellow line (early May).
S&P 500 forecast 2025 – summary
The key points covered in this analysis:
- Economic data are supportive for a bullish stock market outlook.
- Consumer spending should remain stable, directionally.
- Inflation is moving in the right direction, monetary easing should be the resultant.
- Chart patterns are solid for 2025.
- The highest intensity period of the year will be February and May.
- It’s unclear what Fall will give, but intensity should be high (unclear which direction though).
Conclusion: a bullish S&P 500 forecast for 2025. The S&P 500 will move in a range between 5,450 and 6,560 points in 2025.


