In the world of financial markets, uncovering hidden patterns and connections can sometimes lead to remarkable insights. One such concept that merges the realms of time and price is capturing attention—a phenomenon known as time-price harmony. In this forecast, we delve into a discovery involving 20-year treasuries, double bottoms, and an astonishing alignment of time and price.
What should stand out, as readers go through this article is what the exact price point was of the very specific date that we picked, and how it relates to the chart pattern.
While most analysts look at price, only price, we start in this article with time, look what happened with price on a very specific date, map this critical price/time finding to the chart pattern.
1. The Prelude: Double Bottoms and their Intriguing Implications. At the heart of this narrative lies the powerful pattern of a double bottom (W reversal). We start by examining what a double bottom entails and how it holds the potential to predict significant shifts in market sentiment. This bearish omen for interest rates opens the doorway to deeper exploration.
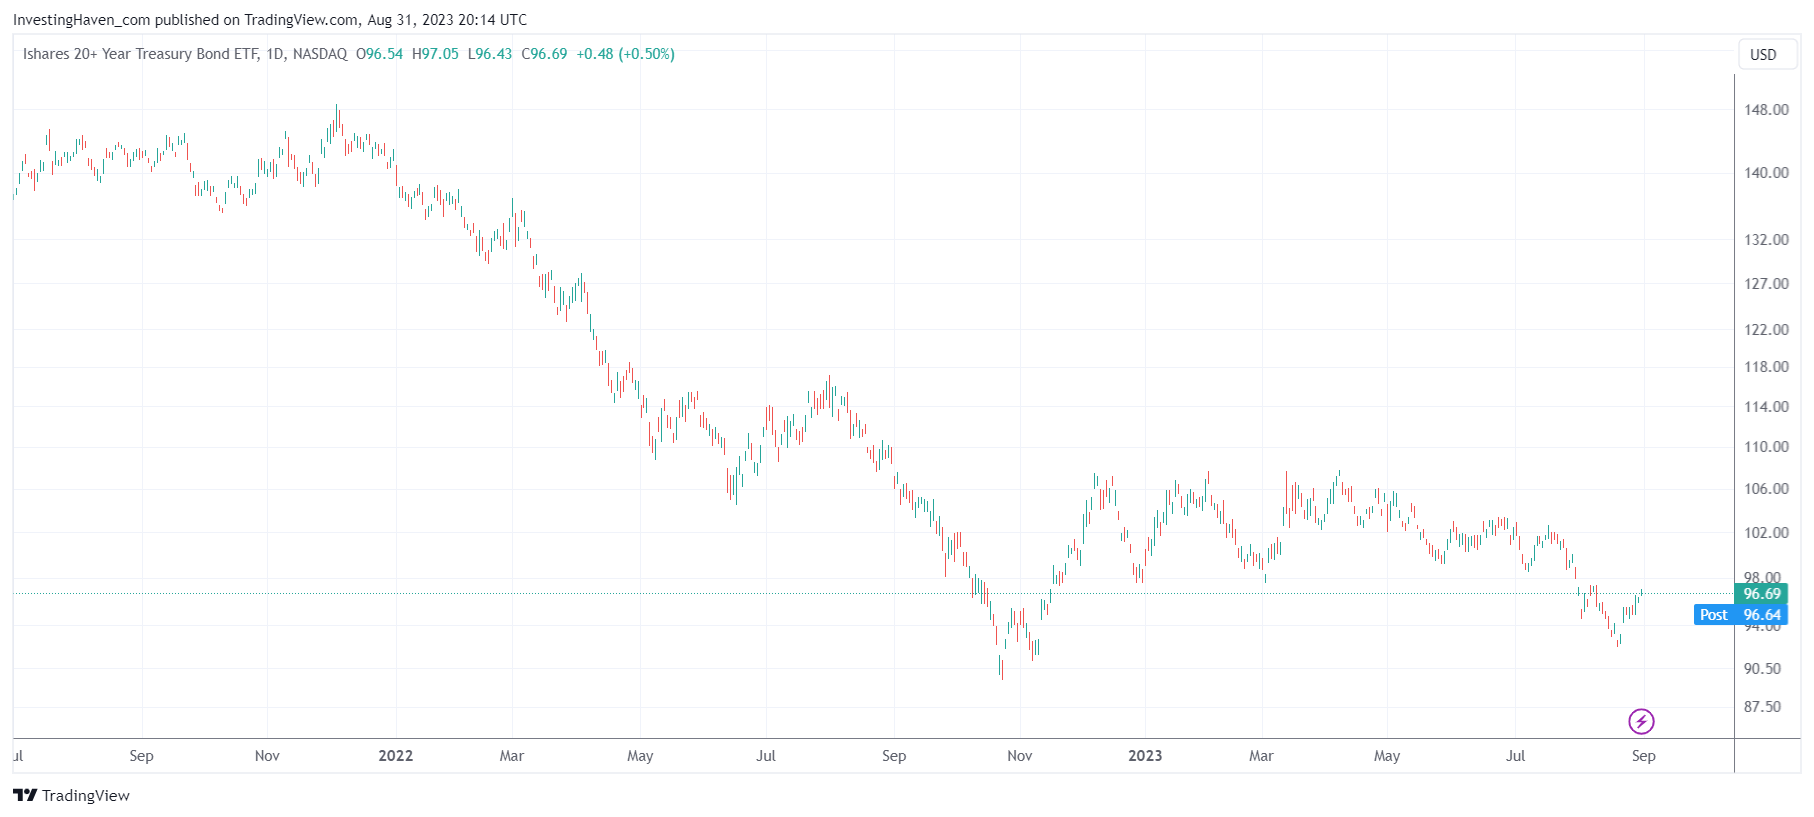
2. The TLT 20-Year Treasuries and Its Hidden Clues. As the spotlight turns to the TLT 20-year treasuries chart, the story of an unfolding narrative comes to life. Through the lens of this chart, we embark on a visual journey, tracing the outlines of potential turning points and hidden symmetries.
3. The Astonishing Time-Price Harmony. The moment of revelation emerges as we observe an almost mysterious alignment of time and price—November 9th, 2022. This date not only marked an epic bottom on the 20-Year Treasuries chart but also unraveled a profound connection between time and price. We explore this convergence and its implications for the future.
4. Echoing Price Points and Echoes in Time. On August 21st, 2023, something crucial occurred. The lows of this day harmoniously resonated with the gap created on November 9th, 2022. This striking phenomenon leads us to believe that the possibility of a double bottom is for real: the power of the chart pattern and time-price harmony coincided, not a coincidence but rather a convergence.
5. Decoding the Patterns and Predicting Peaks. With the pieces of the puzzle coming together, we stand at a crossroads—a potential double bottom that hinges on time-price harmony. The question remains: Can this pattern foretell a major peak in interest rates in 2023? The chart becomes an oracle, revealing insights into a future that seems to be anchored in classic chart patterns.
Conclusion: As we conclude our journey through the interplay of time & price, we conclude that the price point set on November 9th, 2022, particularly on the 20-Year Treasuries chart (TLT) must hold in order for the double bottom to be confirmed. Not any other price point matters, but the one printed on November 9th, 2022. It’s the single most important price point, not just for TLT but in forecasting a major peak in interest rates in 2023 & 2024.