No, there will not be a stock market crash in 2023. Social media, financial media, gurus and the likes were able to trick the majority of investors into the market crash story back in September. It was so easy, everyone and everything was bearish. Many got trapped in the bear trap of Oct 13th. We were going against the tide with this message on the day of the bear trap: The Market Will Not Move 50% Lower Contrary To What The Gurus Are Telling You. Our 2023 forecasts were suggesting that inflation peaked and that leading indicators were in a large topping process. Consequently, the laggards of 2023 (bonds and stocks) should reverse and become leaders in 2023, was the conclusion of many dozens of forecasts. So far, it looks like our market calls were spot-on. We published a summary of the high level 2023 market trends, in this article we look a little deeper in the world of sectors and explain the sectors we expect to be bullish in 2023.
Just two months, ‘everyone and his uncle’ was predicting the next crash. Everyone with a Twitter account suddenly was an expect in market crash predictions. One of the hot topics was the 2008 chart of stock indexes which ‘suddenly’ was predicting that stocks in 2022 would follow the exact same pattern: another leg lower with at least 25% more downside.
We warned premium members and even readers in the public space to stay focused on data points and charts, in other words stick to the facts and ignore emotions. The this-is-2008-all-over is a nice story that sells well, but serious investors should hate storytelling as markets work differently, as explained in great detail in 7 Secrets of Successful Investing.
Here is why 2022 is NOT like 2008: 2008 vs. 2022: Similarities and Differences. It’s not because one chart like SPX looks somehow similar that the entire market and cycle will be the same. What an over-simplification of the complexities of markets, what an overvaluation of Twitter.
One of the key leading indicators we were focused on is inflation expectations. As said in many 2023 forecasts, we expected it to be bottoming October which, if confirmed, would be bullish for metals and markets. This was the long term chart that we shared multiple times, even in the public domain.
We wrote a blog post to illustrate our point: A Bottom In Markets Feels Ugly! This Is What It Looks Like. All articles in this blog post were extremely, extremely bearish. They appeared in financial media on Sept 30th, when the S&P 500 started a breakdown.
Now, suddenly, the sentiment is leaning towards ‘the bear market may be over.’
Go figure!
Be that as it may, we stay focused on the charts and trends, high level and low level trends.
In our latest Momentum Investing alert, published on Dec 3d in the restricted area and shared with premium members, we defined 12 conclusions about sectors in U.S. markets. This is the title of our article “[Chartbook] Sector analysis and big picture trends: 120 charts, 12 conclusions.”
Indeed, we shared 120 charts in a chartbook (pdf, easy to read) with members. They paint a picture about new trends after the market had its RESET moment in 2022. New trends are there for those that are able to find them.
In our chartbook we looked at all commodities, regions and countries, the 9 leading sectors in the U.S. and a few hundreds of subsectors.
Yes, there are clear conclusions and trends we see. They are consistent. The market trends in 2023 will be very, very different compared to 2022.
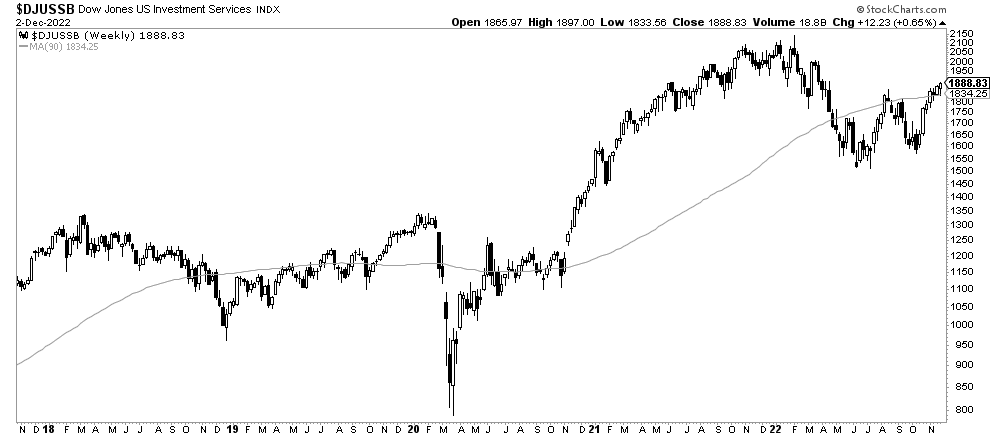
One of the charts that stood out is the one featuring investment services in the U.S. As seen, this is a bullish chart. Our commentary to premium members: “The U.S. stock market would not have a bullish outlook if financial stocks would not be bullish. If segments like banks are bullish, if segments like broker/dealer stocks and investment services are bullish, it should be confirming the bullish outlook for U.S. markets.”
In other words, this first chart confirms our bullish outlook for stocks in 2023.
We defined 12 conclusions based on 120 charts in our chartbook. We pick out 3 charts to illustrate our work, for more details we encourage readers to sign up to Momentum Investing and access all charts. It’s worth the small fee, really.
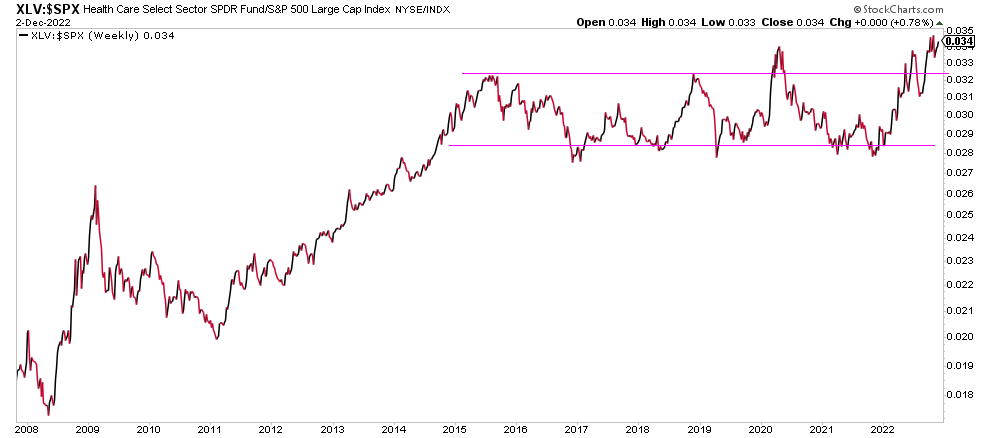
The health sector stands out against the other sectors in U.S. markets.
We came to this conclusion not just by analyzing the health sector chart but also the relative strength chart of health against the S&P 500. A secular breakout is what we can see on the next chart, very bullish! We also featured the most bullish subsectors in health in our chartbook.
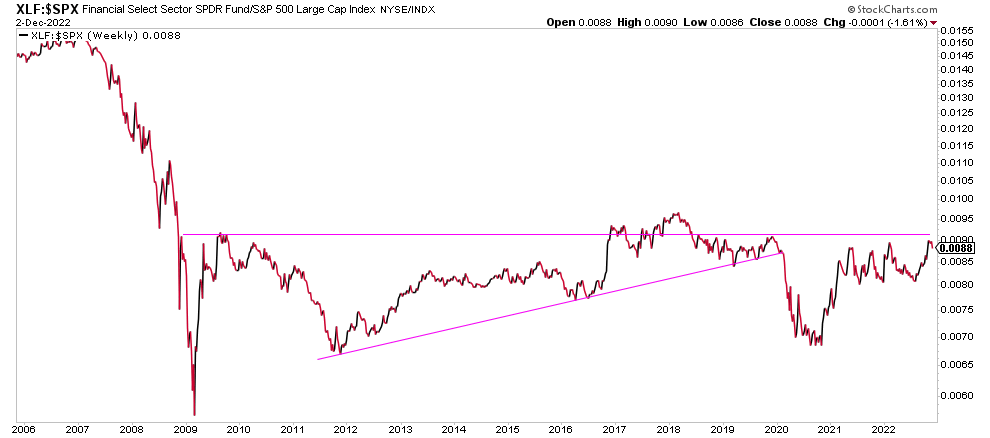
Financials against the S&P 500 look very bullish although they did not break out, not yet. Here is the point: financials should be tracked, closely, because once they are able to clear 12 year resistance on their relative strength chart we should be heavily invested in this sector!
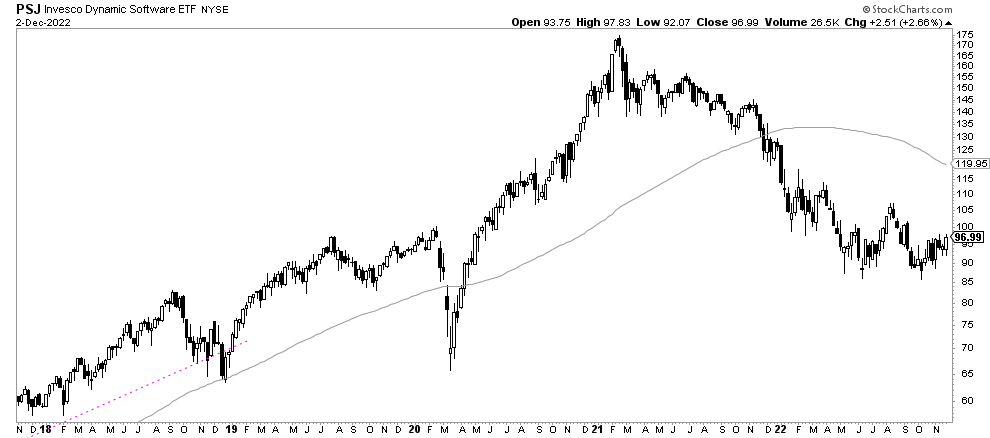
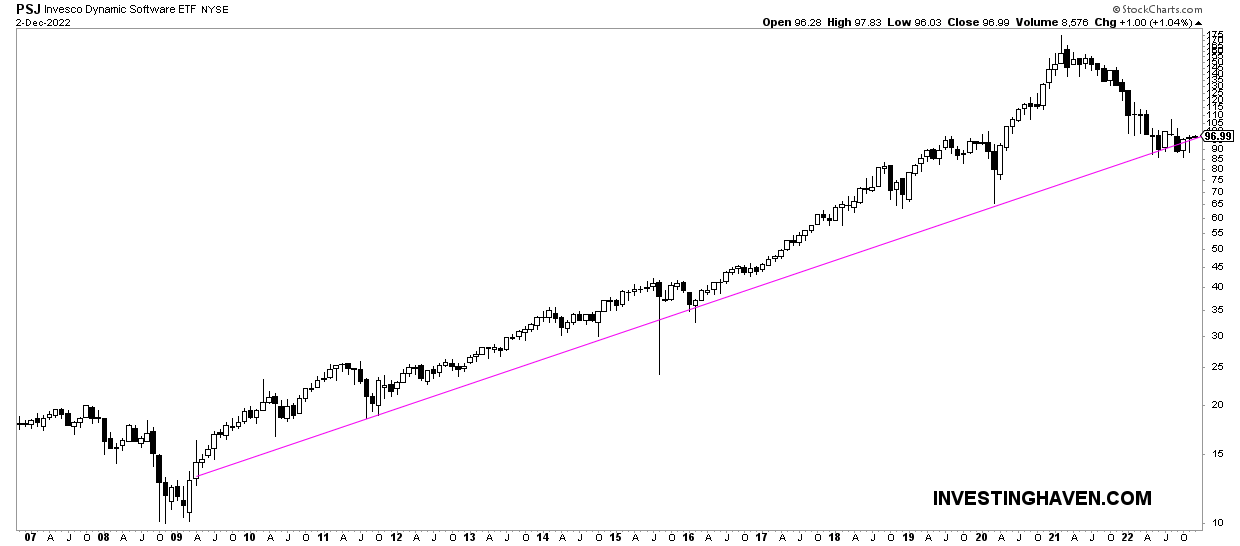
In tech stocks, we noticed bi-furcation. Some sectors (like mobile telco) have a bearish setup but here is one that has a really nice reversal (double bottom, easy to spot) on its weekly chart: software!
The software chart on 15 years, monthly timeframe, confirms how important this current level is.
Must-Read 2023 Predictions – We recommend you read our 2023 predictions as they are very well researched:

